Introduction
When it comes to performance, Intel has been the one to beat for quite some time. The Core i series Nehalem CPUs provided a fantastic boost in performance over the Core 2 line. The new Sandy Bridge CPUs look to provide another boost, but is the leap as dramatic? Today we’ll be taking a look at the Core i5 2300, which fills the lowest slot in the i5 range for this generation. Let’s see just how well this middleweight CPU manages to hold its own.
Intel’s Take
TAKING PRODUCTIVITY TO THE NEXT LEVEL; the 2nd Generation Intel® Core™ i5 Processor. The Intel® Core™ i5 processor delivers the next level of productivity. With Intel® Turbo Boost Technology 2.0, this quad-core processor with 4-way multitasking capability delivers extra speed whenever you need it as well as security features to help protect information and data.
Experience the advantages of great responsiveness and performance that automatically adapts to whatever you’re doing. Whether you use your PC for simple applications and photos or venture into 3D gaming and HD videos, now you can have a visibly better PC experience with the 2nd generation Intel® Core™ i5 processor.
The i5 2300 shares much in common with its sibling, the i5 2500K. If you want to know about every last detail of the new Sandy Bridge architecture, you can find it right here. Chris did a spectacular write-up on the new technology; I highly suggest you take a look. Rather than rehash everything he wrote, I’ll be highlighting the differences between the two.
A Closer Look
 |
 |
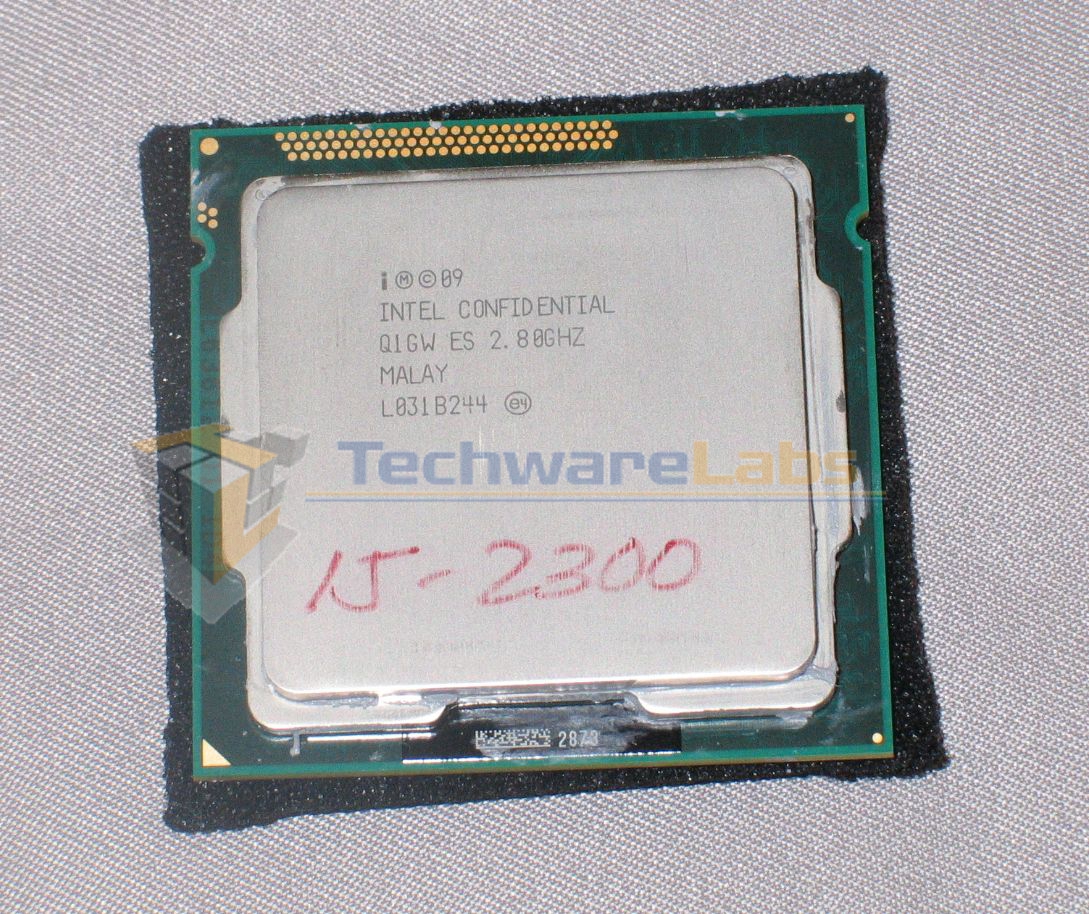
First, a look at the CPU die itself. Those white smudges around the edges are the remnants of an over-generous coating of thermal paste; whoever tested this CPU as it was heading out the door was a little overzealous. Still, none of it got on the contacts, so we’re good to go.
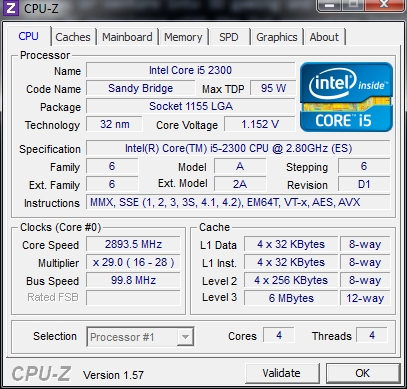
CPU-Z gives us the details about this particular CPU; and so far, it’s looking a lot like it’s peppier sibling, the Core i5 2500K. The only difference so far is the lower multiplier, which lines up neatly with its 2.8GHz rated speed.
 |
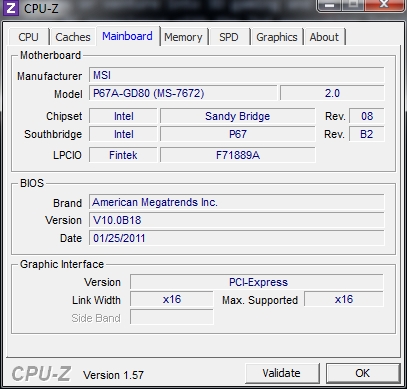 |
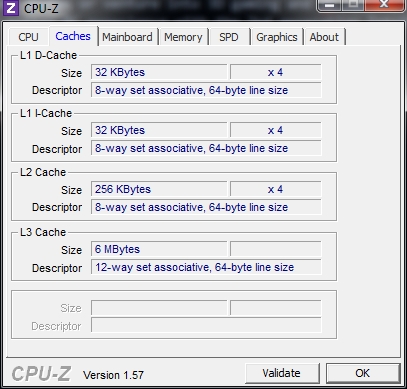
When it comes to caches, the i5 2300 again keeps pace with its higher-clocked sibling. We’ll be putting this chip through its paces with the help of the P67 rev 2 chipset. The only change to this version of the Cougar Point controller is a fix for the degrading-SATA-port issue.
Benchmarks
Now, of course, we get to the real meat of the matter: the testing. Our test board has no video headers, so we’ll be skipping the evaluation of the HD 2000 graphics unit. Other than that, though, we’ll be putting this chip through a thorough round of testing, so buckle up!
Test System
| Test System | |
| CPU | Intel Core i5 2300 @ 2.8GHz |
| Heatsink | Intel stock cooler |
| Motherboard | MSI P67A-GD80 |
| Chipset | Intel P67 rev 2 (Cougar Point) |
| Graphics card | Sparkle GeForce GTX 465 |
| RAM | 2x4GB SuperTalent DDR3-2000 @ 1300MT/s, CL9 |
| Sound | Creative Sound Blaster X-Fi Titanium HD |
| SSD | Crucial RealSSD 256GB SATA 6Gb/s |
| HDD 1 | Western Digital Caviar Green 5400RPM 500GB |
| HDD 2 | Western Digital Caviar Green 5400RPM 1.5TB |
| Power Supply | OCZ 750W Fatal1ty Series |
| Case | Silverstone Fortress FT-02 |
| OS | Windows 7 Ultimate |
| Drivers | Forceware 266.58 |
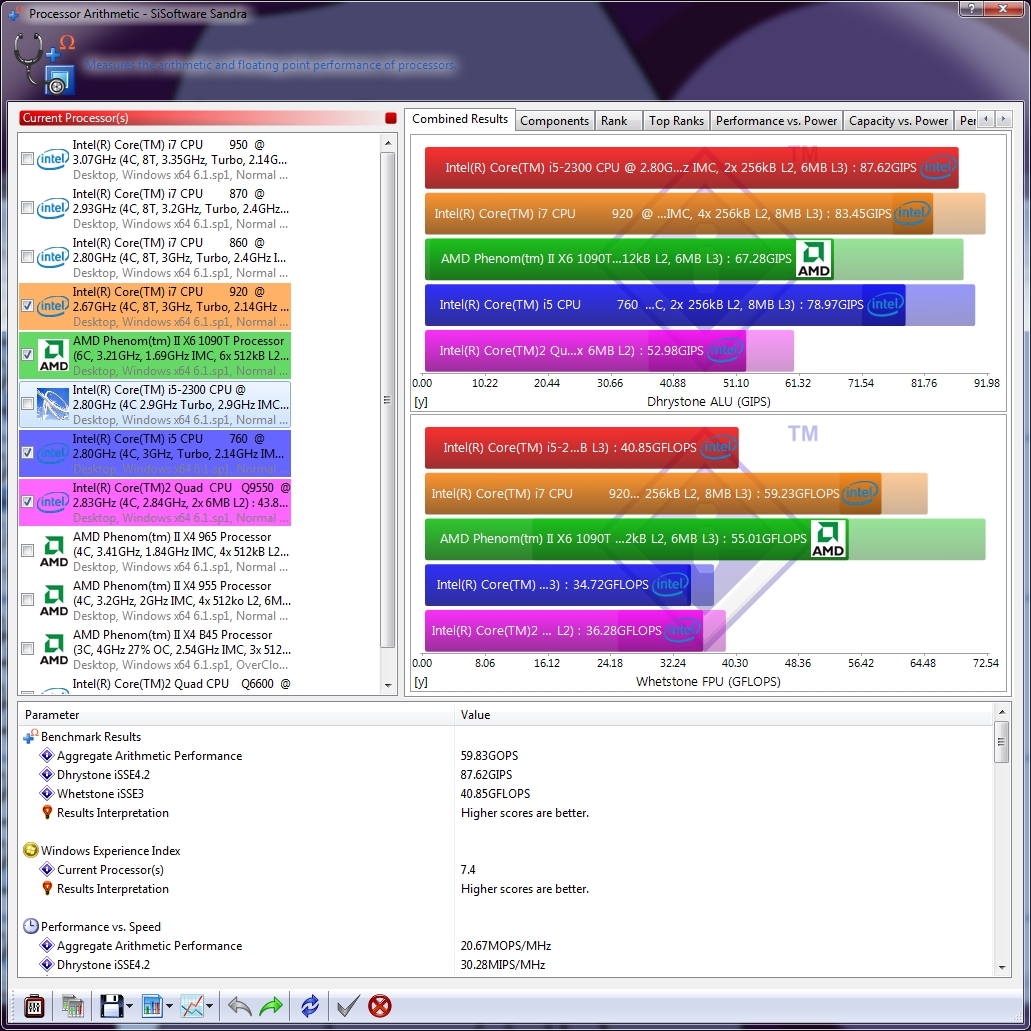
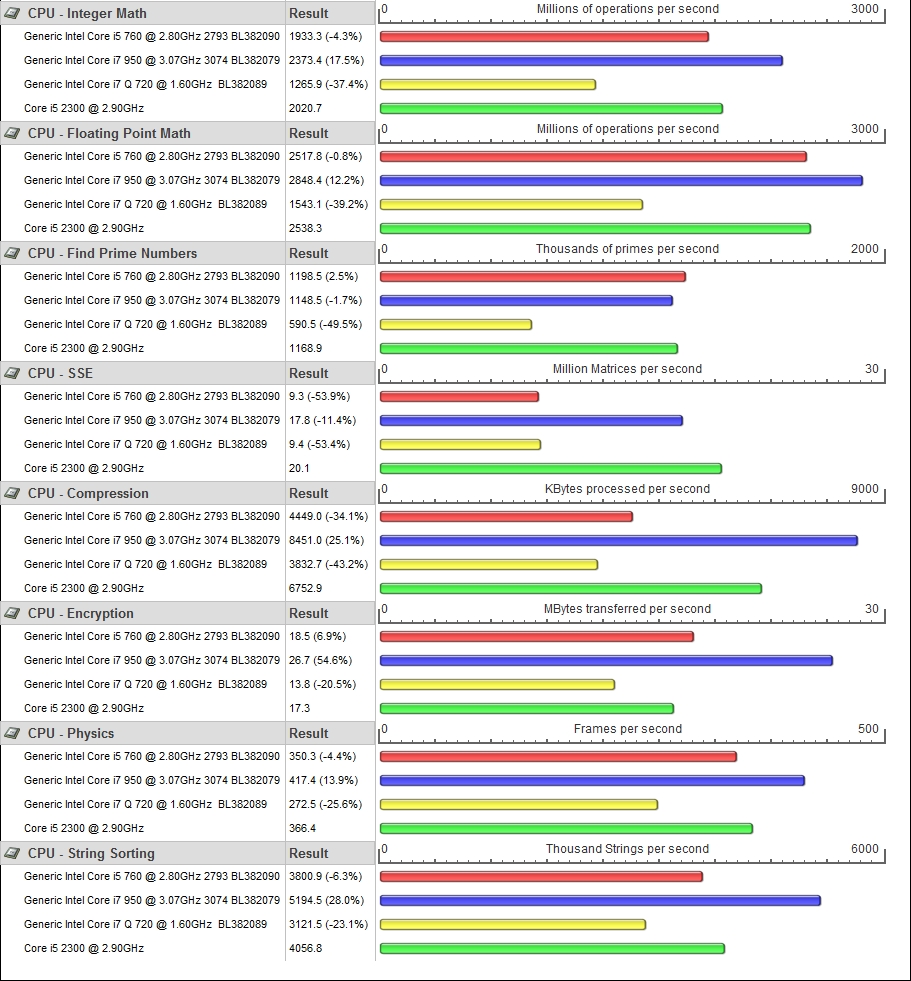
Sandra 2011
We’ll start off with one of the most comprehensive of the bunch, SiSoftware’s Sandra.
 |
 |
Right out of the gate, we see some eye-raising numbers. The i5 2300 manages to smoke all comers in the Dhrystone ALU test, coming out ahead of both AMD’s Phenom II X6 1090T and the Core i7 920 from Intel’s own previous generation. The Whetstone FPU results are more modest, though the i5 2300 still manages to stay ahead of the i5 760 by a healthy margin.
 |
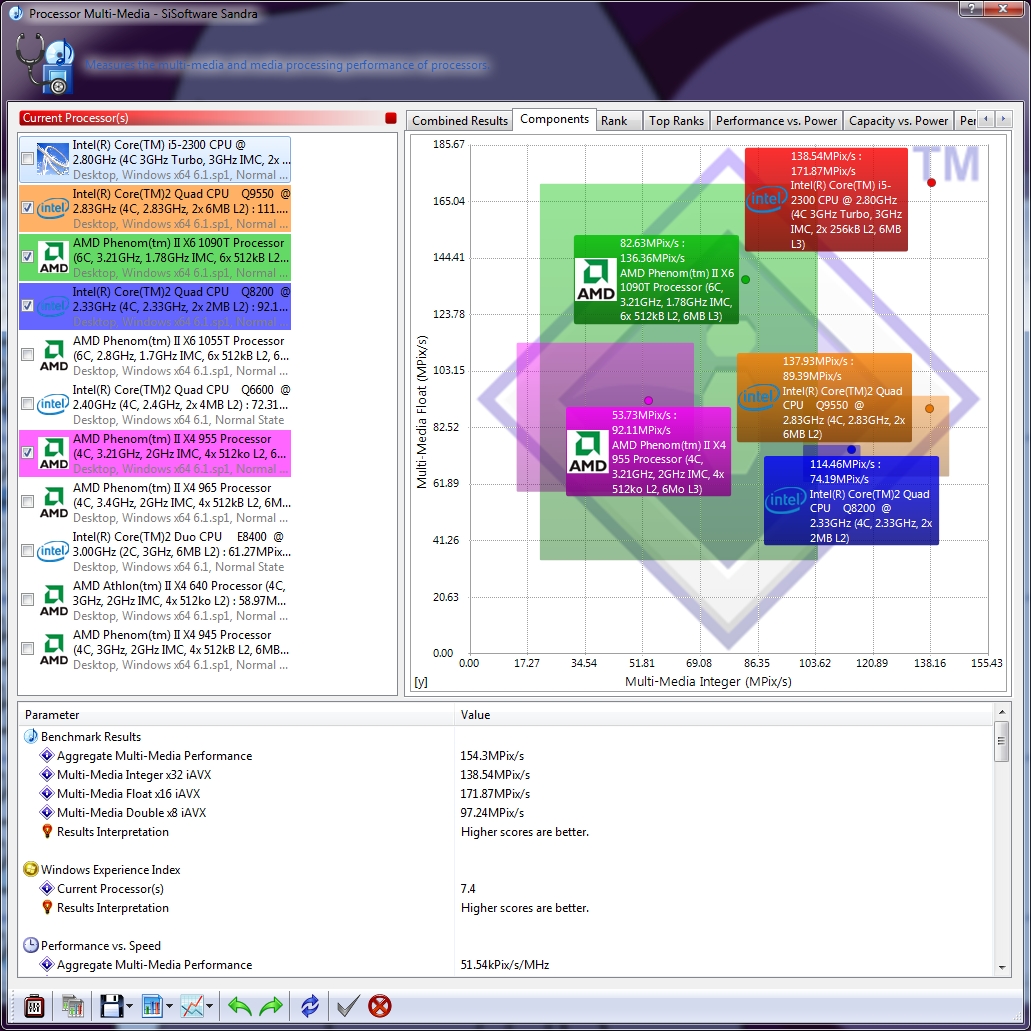 |
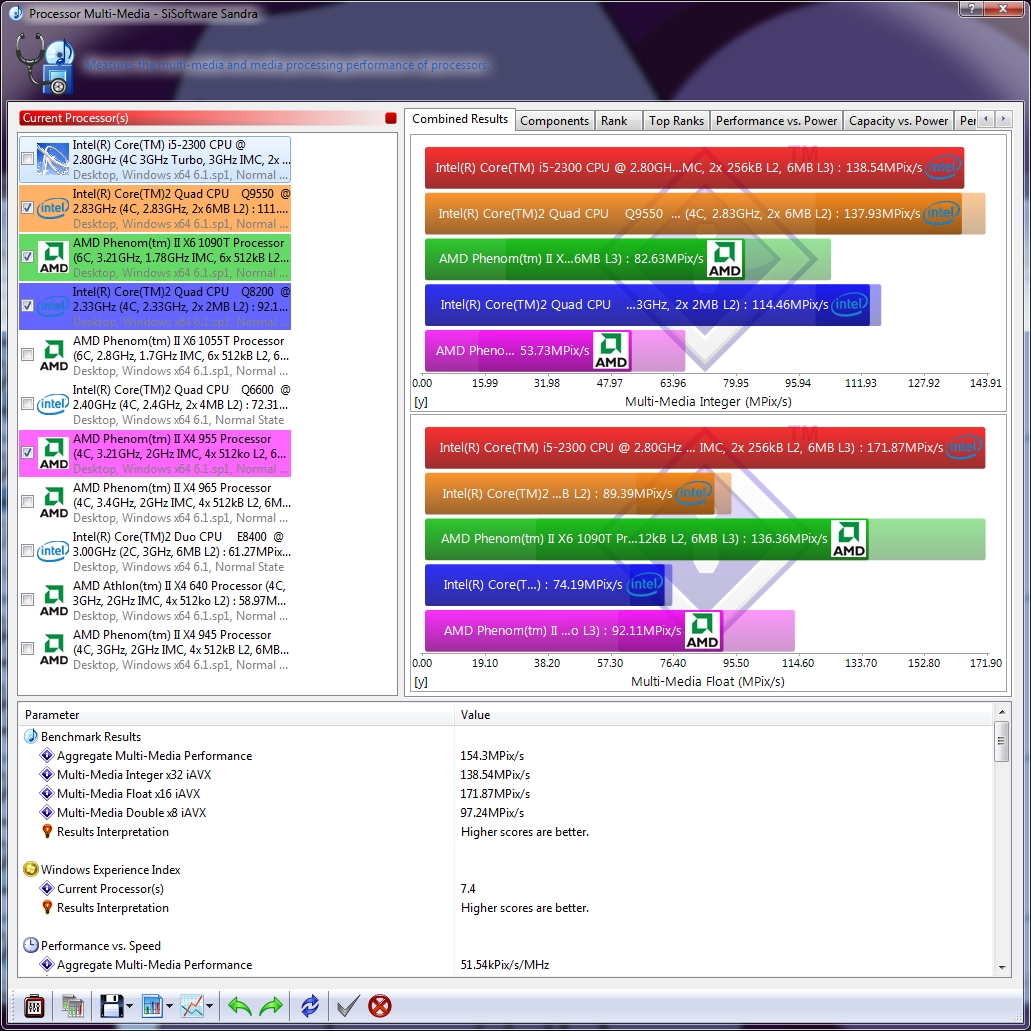
The oddities continue in the multimedia tests; the i5 2300 just barely squeaks into first place in the multimedia integer test ahead of the Core 2 Quad Q9550. Things are somewhat more clear-cut in the multimedia float test, where the i5 2300 pulls far ahead of the competition.
 |
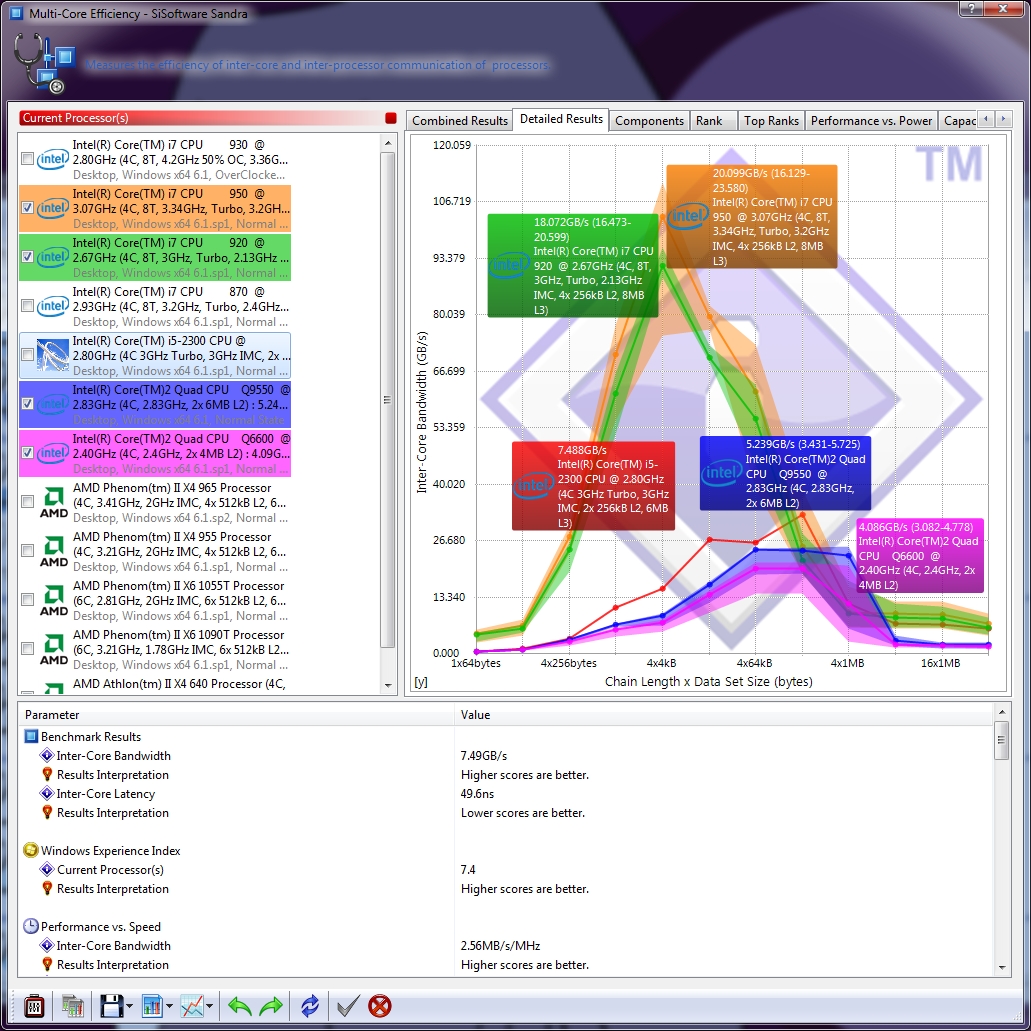 |
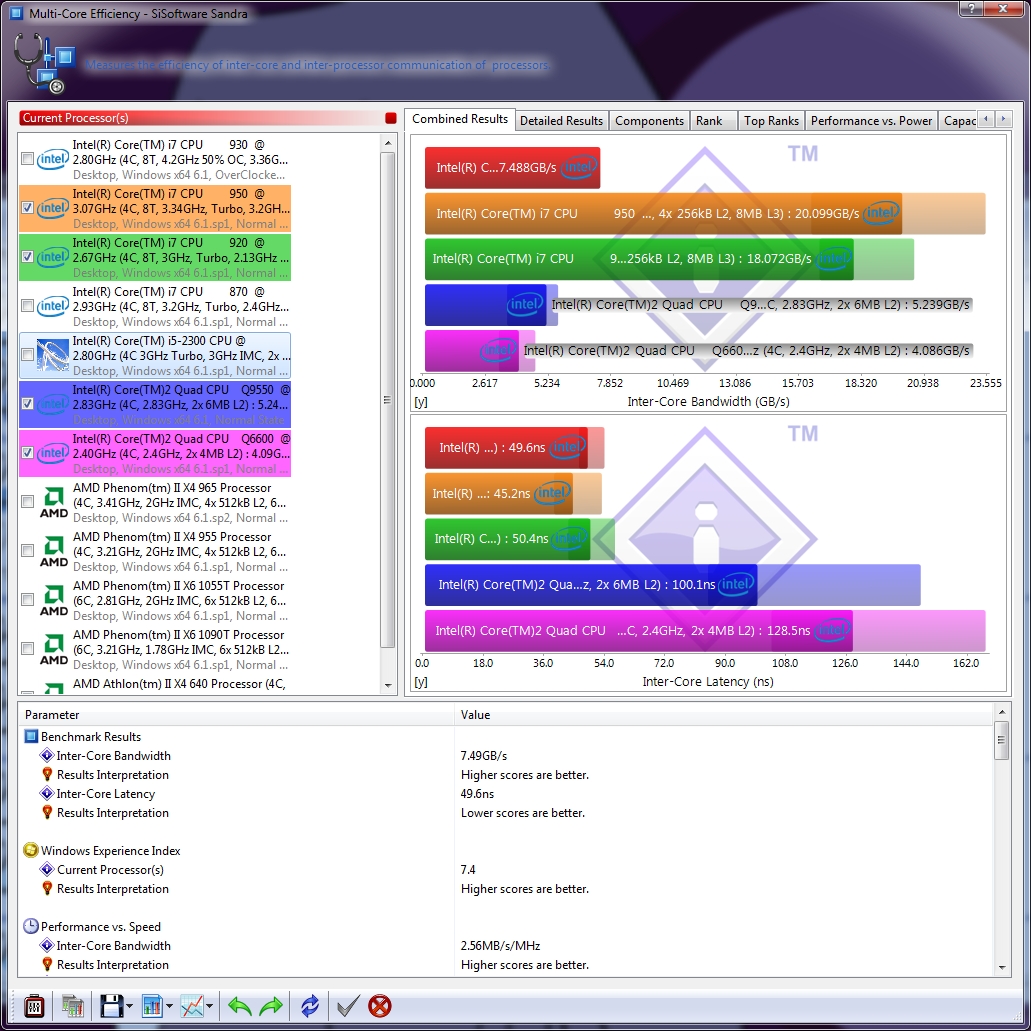
Things are looking a little more bleak in the multi-core efficiency tests; the inter-core bandwidth test shows the Nehalem i7 CPUs pulling ahead due to their support for Hyper-Threading. The inter-core latency test comes up rather rosier though, with the i5 2300 pulling ahead of all but the i7 950 in response time.
 |
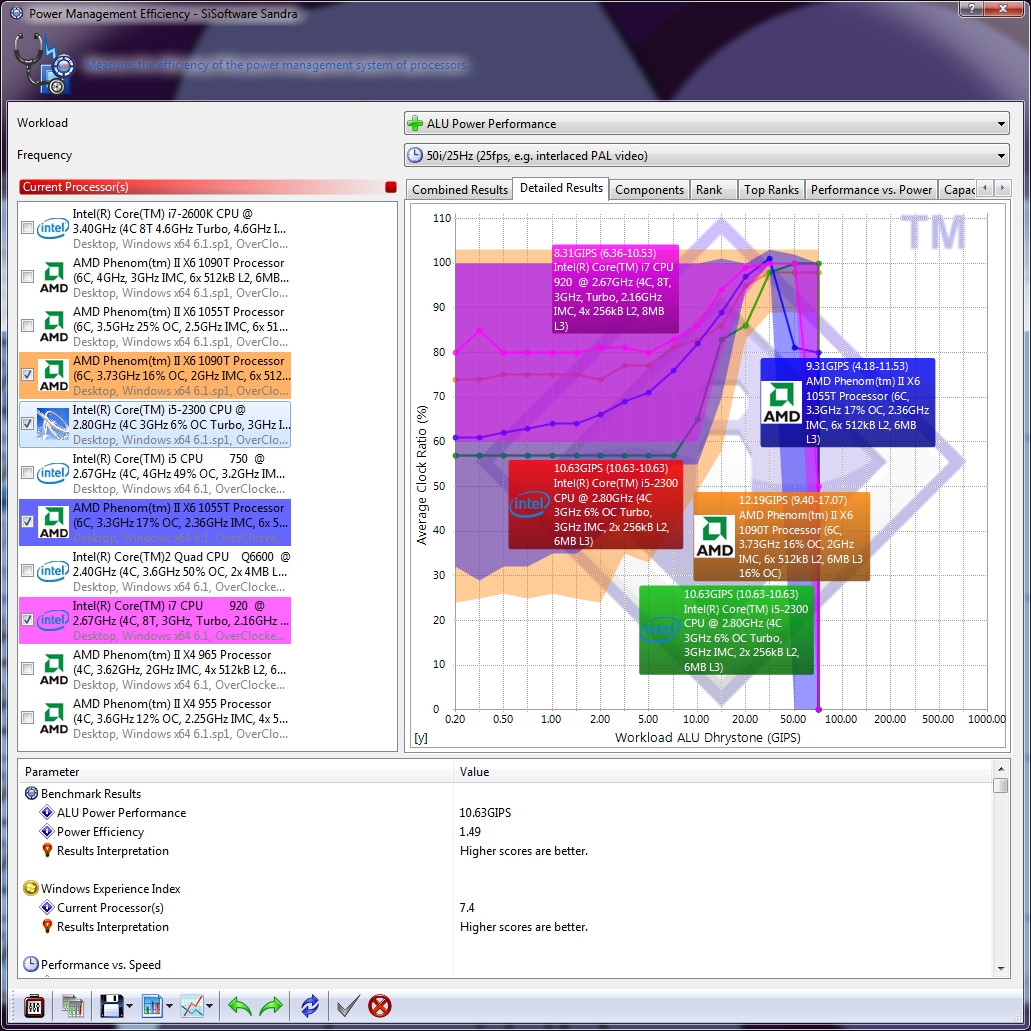 |
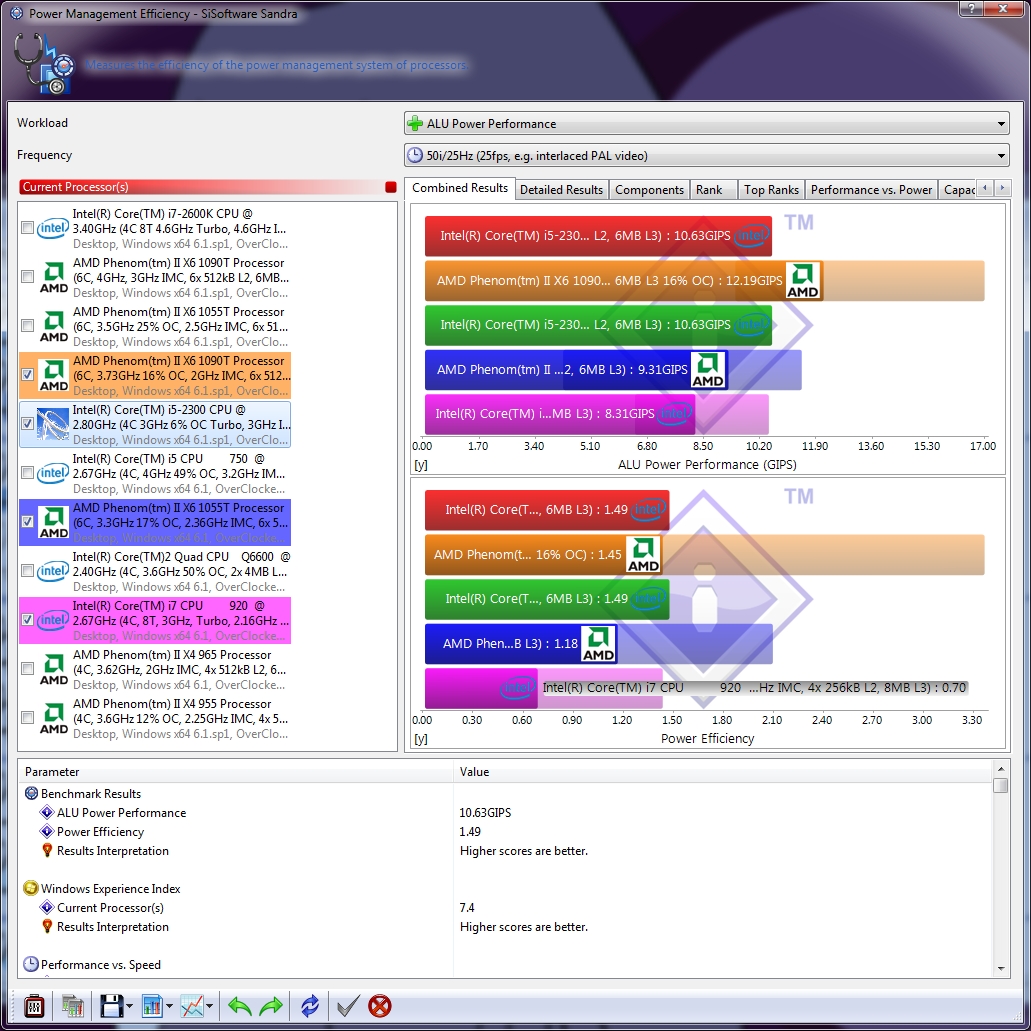
No slouch in the efficiency department, the i5 2300 comes in just behind the Phenom II X6 1090T on the ALU power performance test, and just about even on the power efficiency ranking.
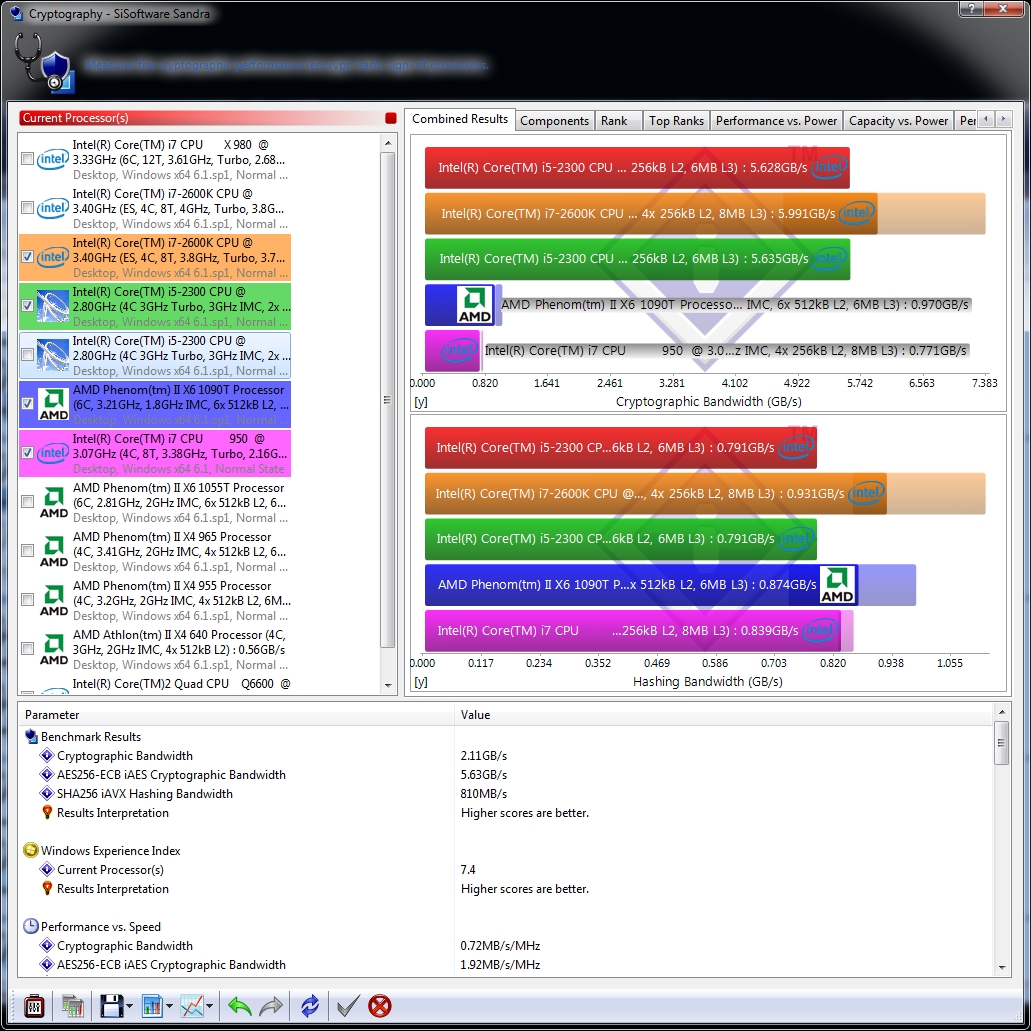 |
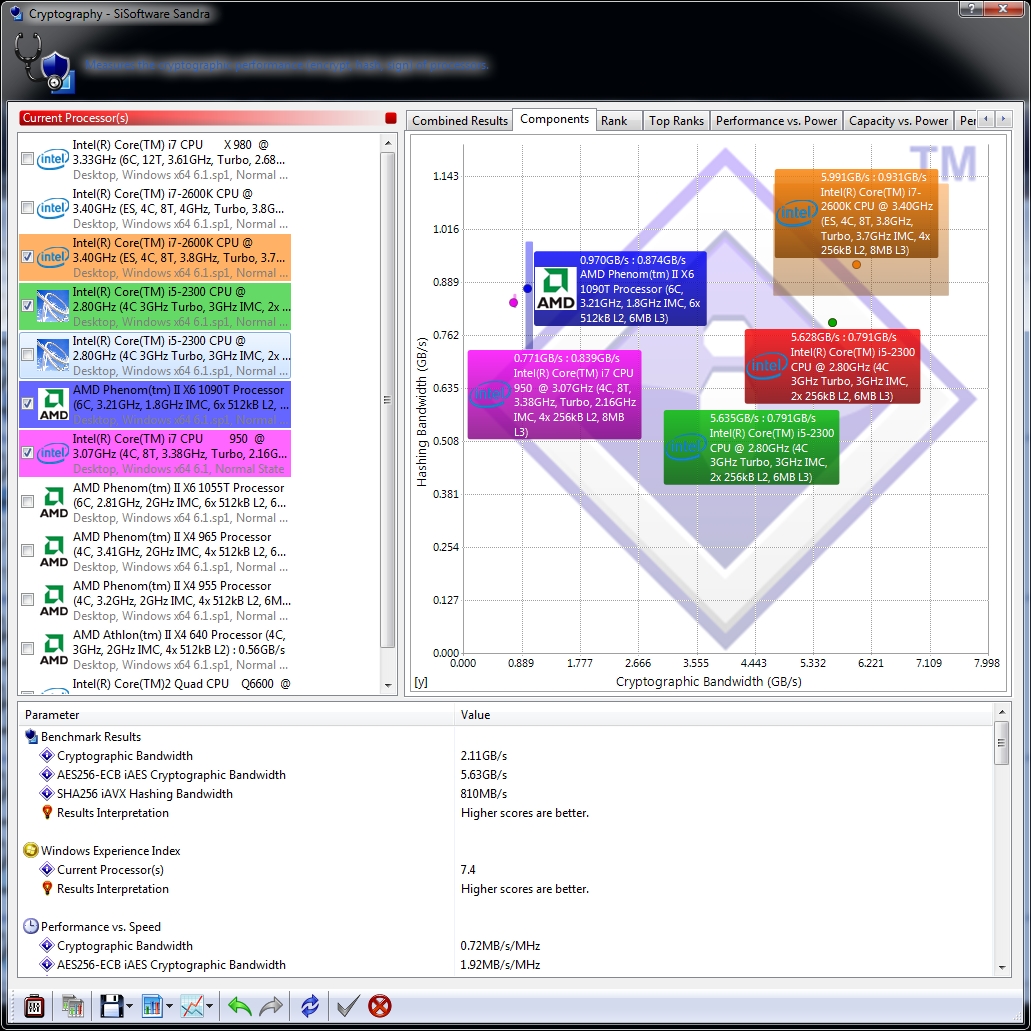 |
In a rather surprising upset, the i5 2300 comes in ahead of both the Phenom II X6 1090T and the i7 950 by a rather shocking margin in the cryptographic bandwidth test. Things are different in the hashing bandwidth test though, with the i5 2300 coming in behind both the 1090T and the i7 950 by a fair margin. Unsurprisingly, the i7 2600K smokes all comers in the same test.
 |
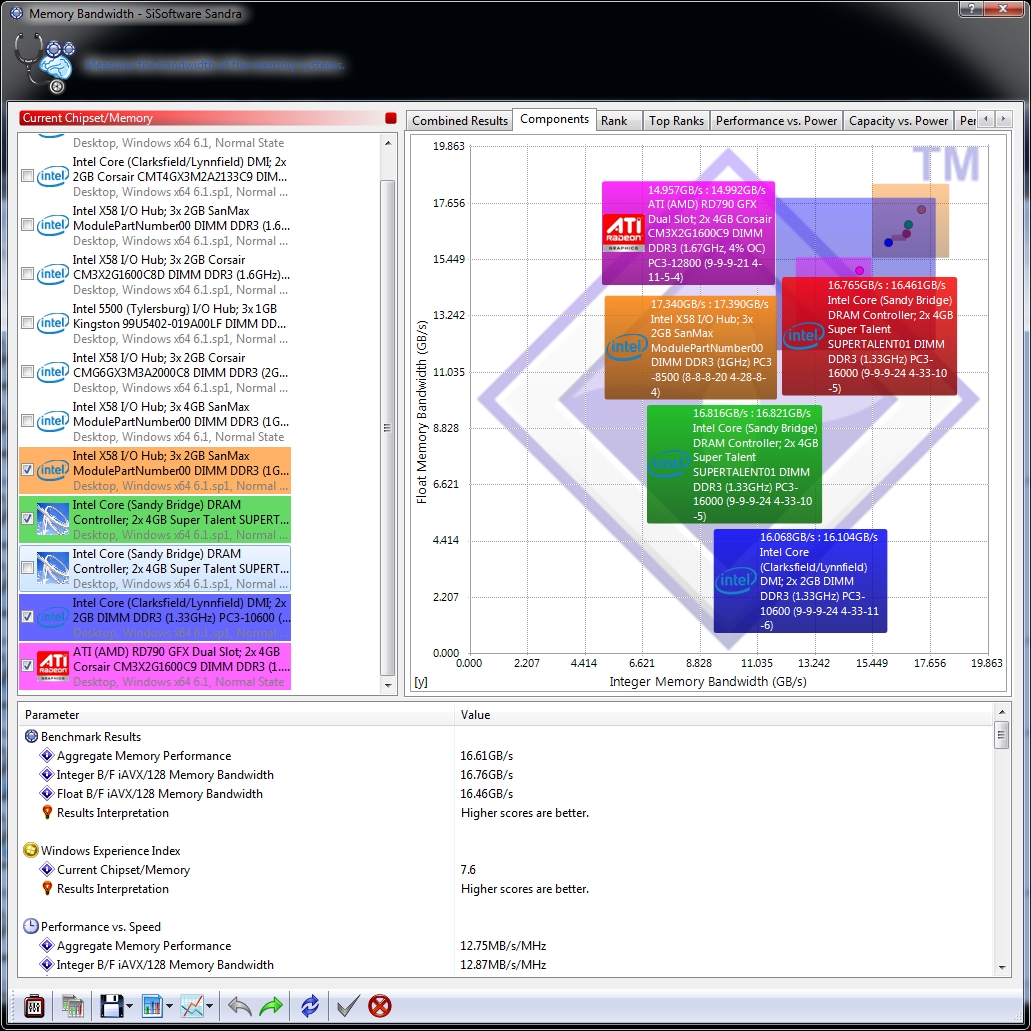 |
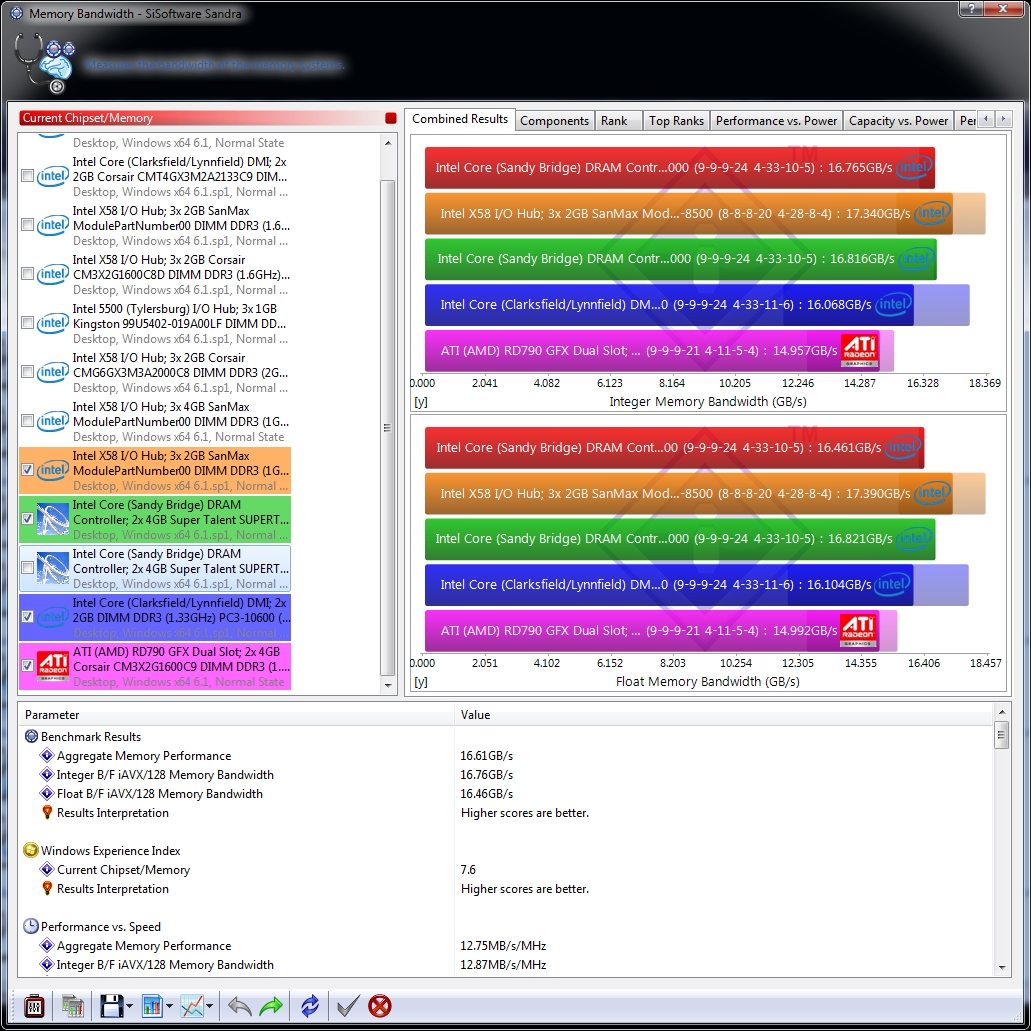
Since all modern desktop CPUs have the memory controller on-die these days, it behooves us to test the performance on that as well. The integer and float memory bandwidth test results look nearly identical, with the Sandy Bridge controller coming in just shy of the Nehalem’s X58 controller. Especially notable is that the X58 is running in triple-channel mode–apparently buying your ram modules in threes is no longer necessary for blistering speeds!
 |
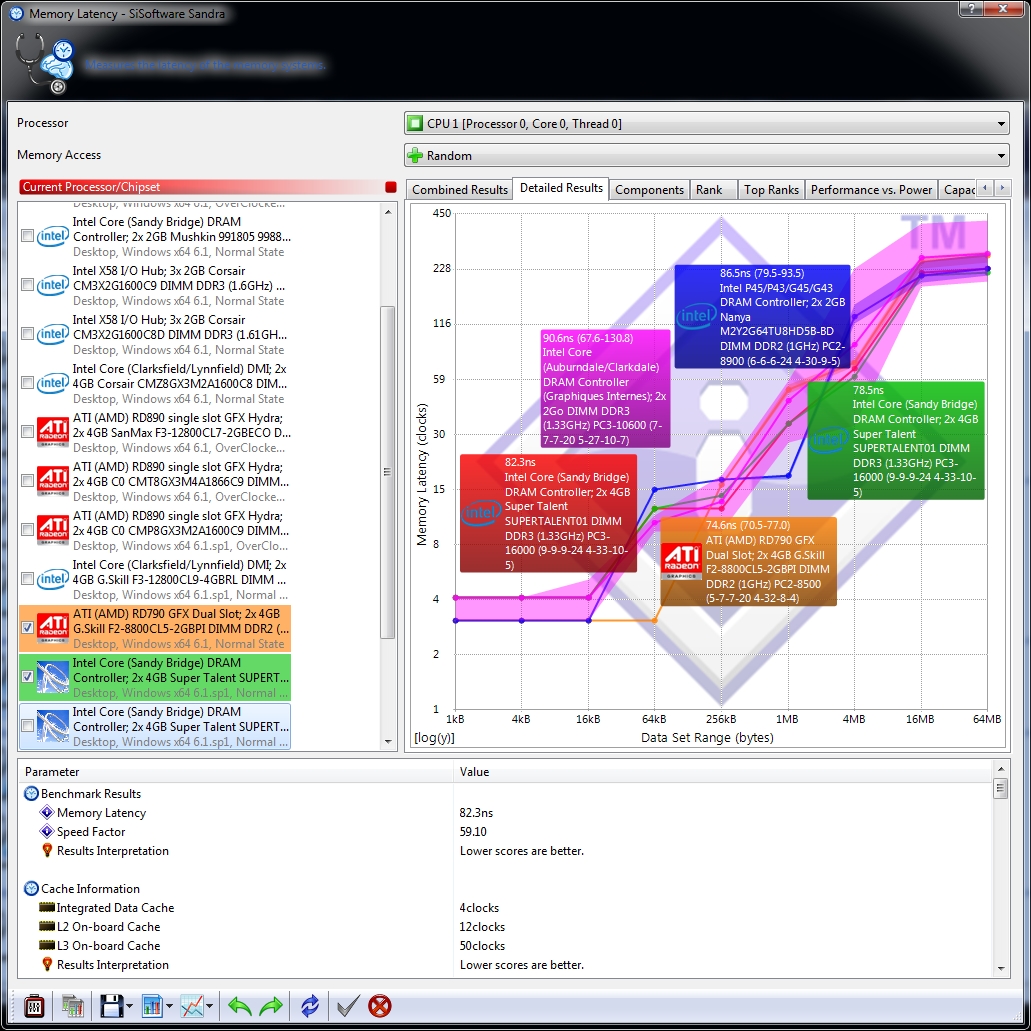 |
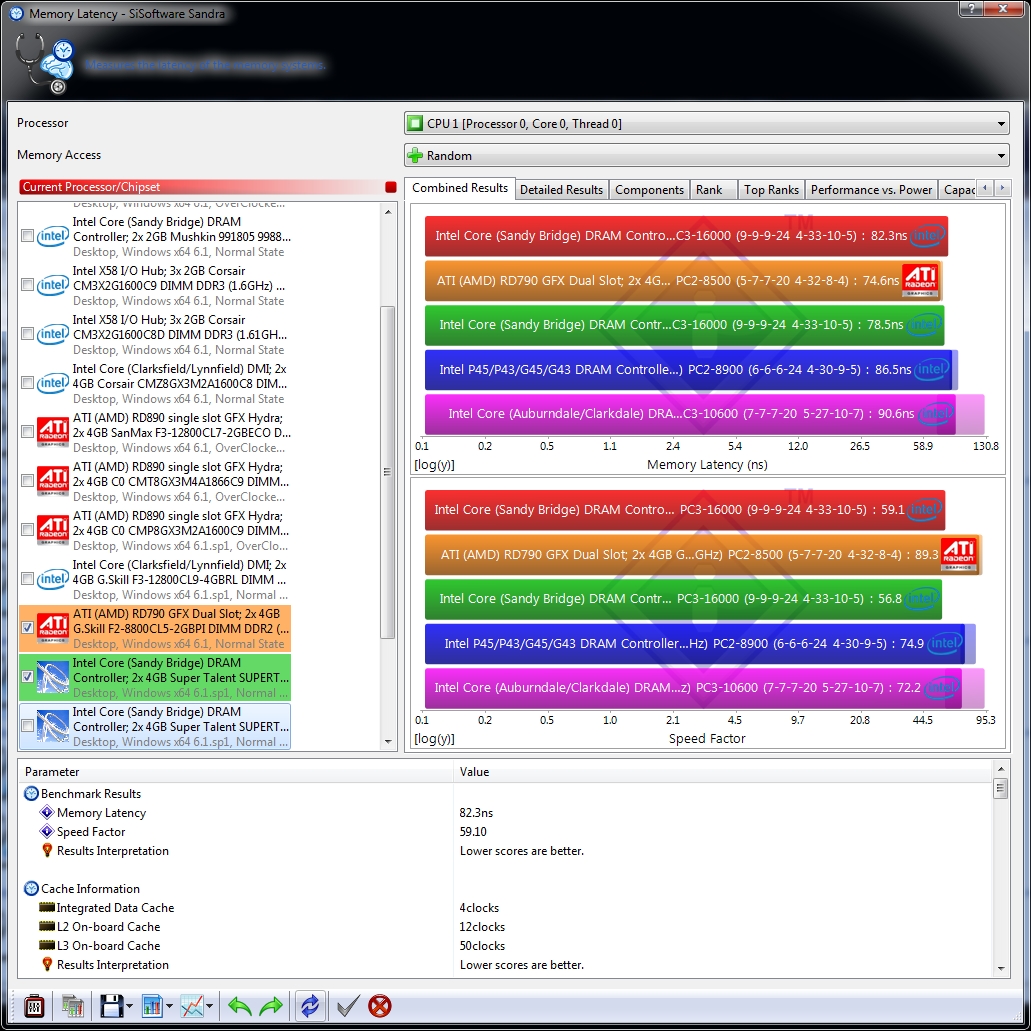
The memory latency tests come in equally close, with the AMD 790FX barely edging out the lead. This can mainly be attributed to the much tighter timings typical of DDR2 ram, though interestingly the difference in memory clock speed seems to shave much of that advantage away.
 |
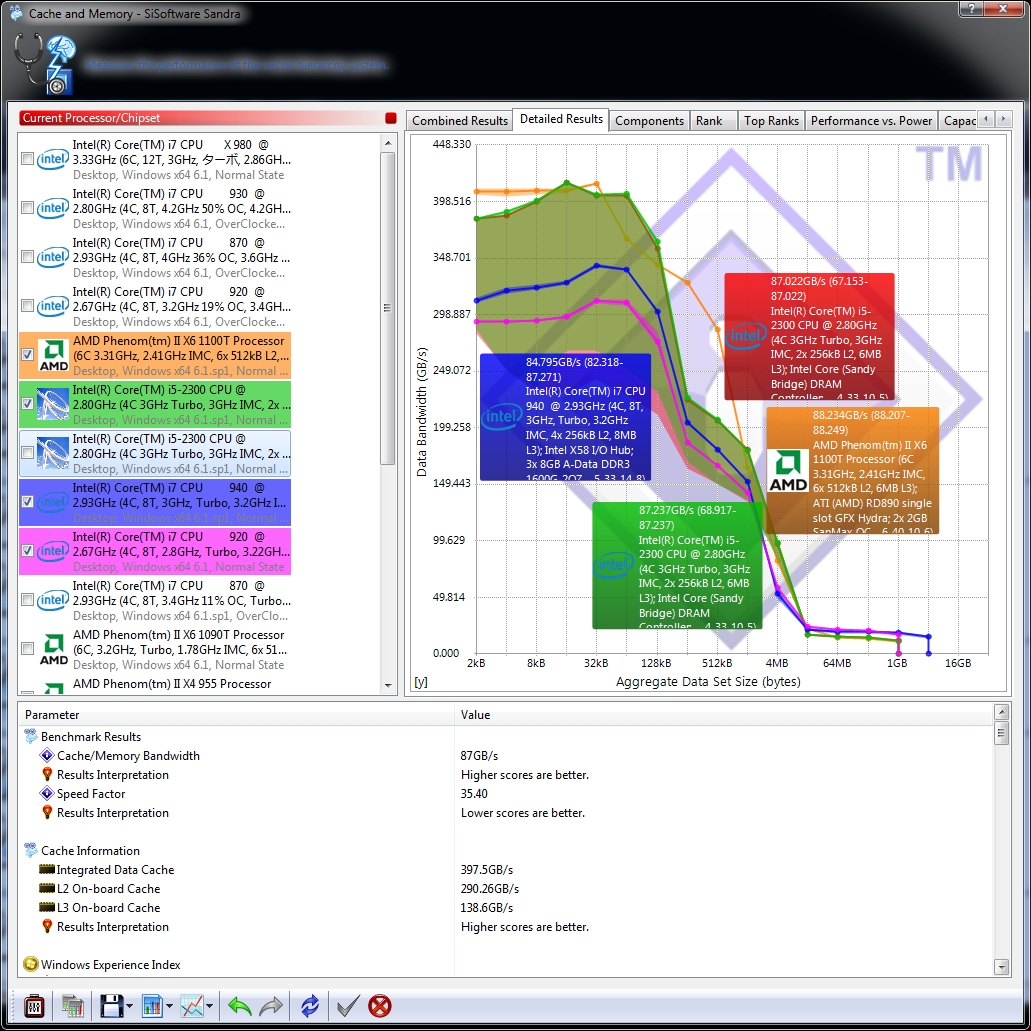 |
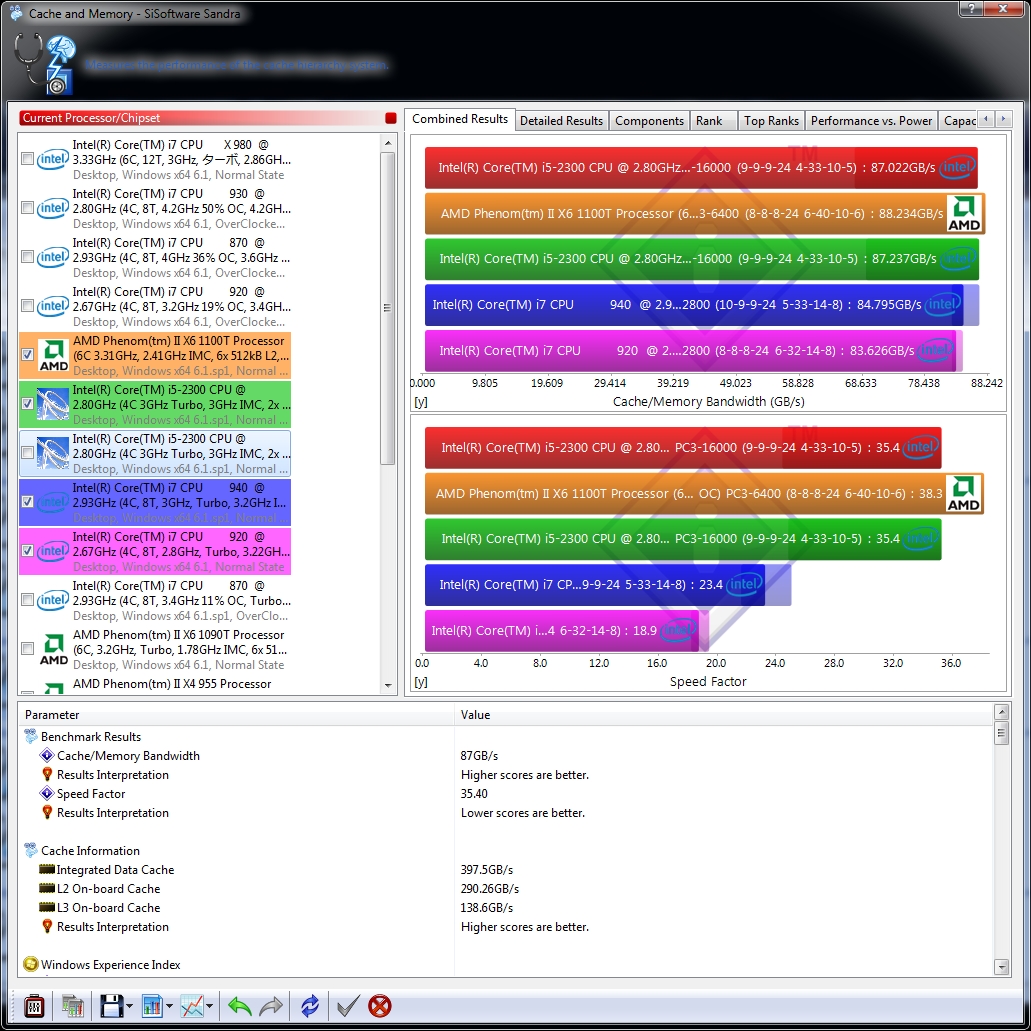
The cache and memory test gives us a look at the aggregate bandwidth of all the memory available to the CPU, both on-die caches and RAM. Here the i5 2300 finishes neck-and-neck with the Phenom II X6 1100T.
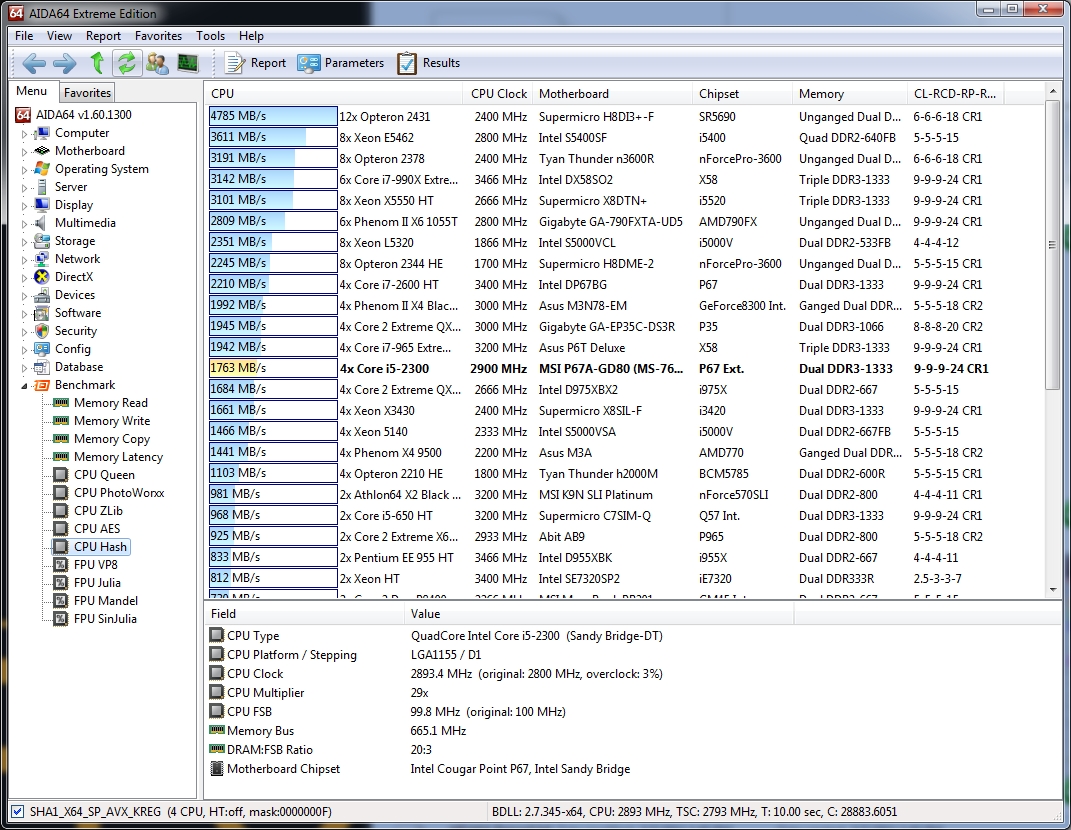
AIDA64
Next up in our list of benchmarking tools is AIDA64, a suite that rivals Sandra for thoroughness.
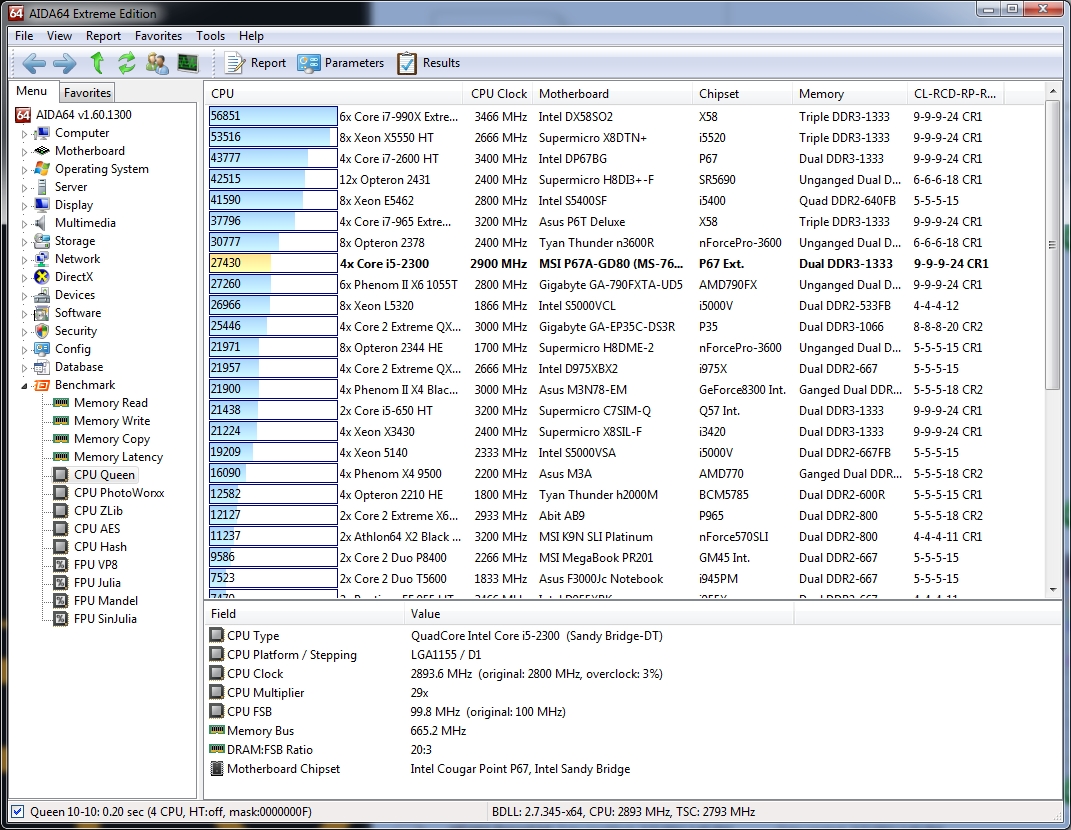
From the AIDA64 website, regarding the CPU Queen benchmark:
This simple integer benchmark focuses on the branch prediction capabilities and the misprediction penalties of the CPU. It finds the solutions for the classic “Queens problem” on a 10 by 10 sized chessboard. At the same clock speed theoretically the processor with the shorter pipeline and smaller misprediction penalties will attain higher benchmark scores…
Intel is clearly doing something right with the Sandy Bridge architecture; the i5 2300 scored higher than all the quad-core CPUs, save only those with hyperthreading—and thus more logical threads available.
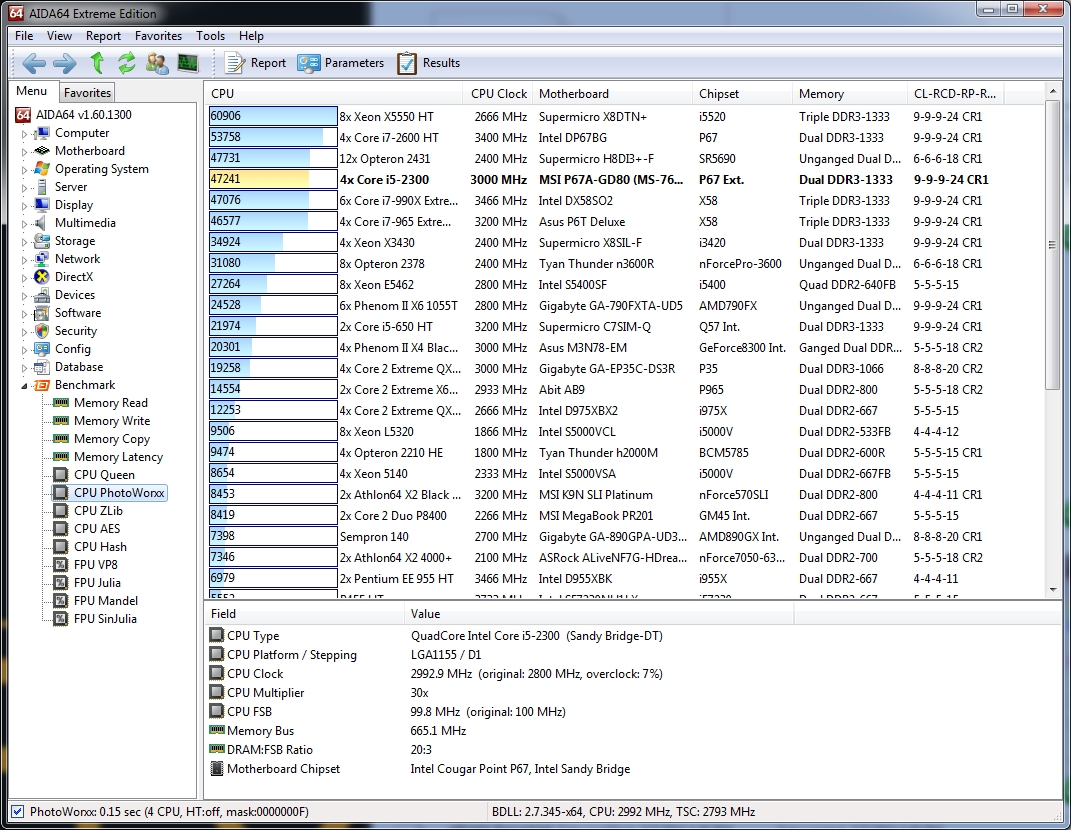
Regarding the CPU PhotoWorxx benchmark:
This benchmark performs different common tasks used during digital photo processing…
This benchmark stresses the integer arithmetic and multiplication execution units of the CPU and also the memory subsystem. Due to the fact that this test performs high memory read/write traffic, it cannot effectively scale in situations where more than 2 processing threads used. For example, on a 8-way Pentium III Xeon system the 8 processing threads will be “fighting” over the memory, creating a serious bottleneck that would lead to as low scores as a 2-way or 4-way similar processor based system could achieve. CPU PhotoWorxx test uses only the basic x86 instructions, and it is HyperThreading, multi-processor (SMP) and multi-core (CMP) aware.
Again the i5 2300 shows its muscle, beating out all but its own i7 sibling and a pair of server-grade CPUs.

Regarding the CPU ZLib benchmark:
This integer benchmark measures combined CPU and memory subsystem performance through the public ZLib compression library. CPU ZLib test uses only the basic x86 instructions, and it is HyperThreading, multi-processor (SMP) and multi-core (CMP) aware.
Here the i5 2300’s performance is somewhat more modest, but again the pack ahead of it is filed with high-end enthusiast and server CPUs.
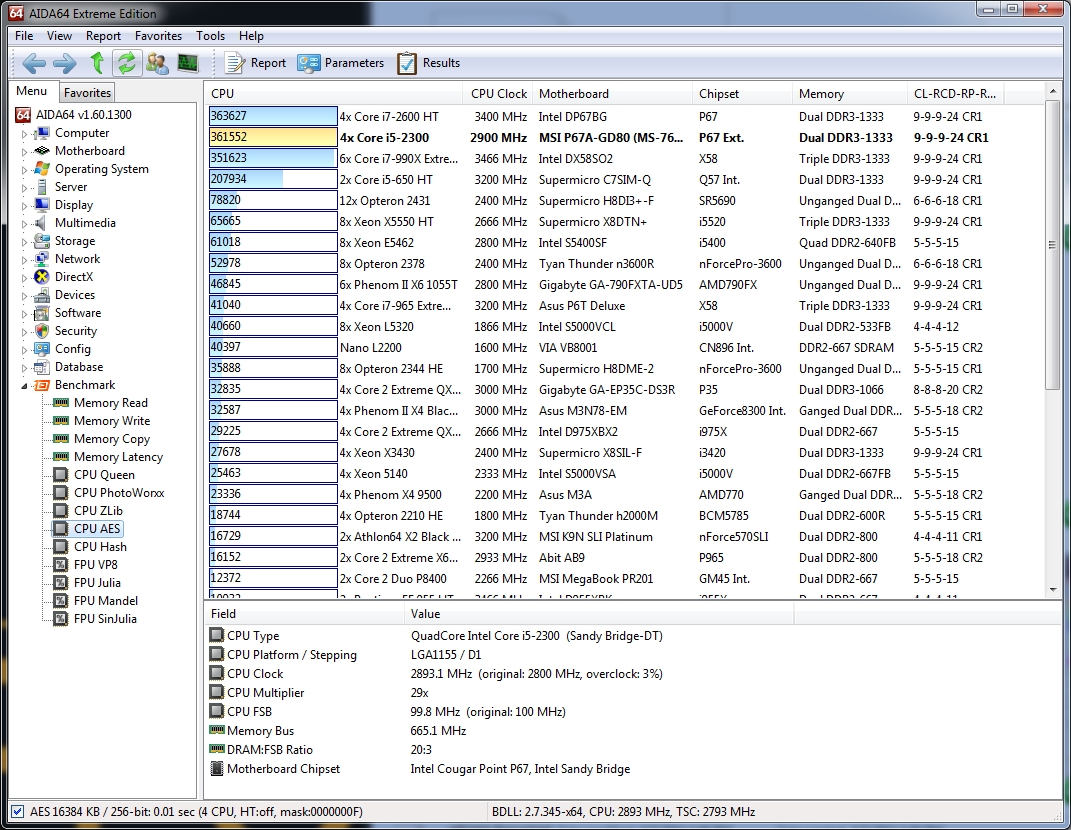
Regarding the CPU AES benchmark:
This benchmark measures CPU performance using AES (Advanced Encryption Standard) data encryption. In cryptography AES is a symmetric-key encryption standard. AES is used in several compression tools today, like 7z, RAR, WinZip, and also in disk encryption solutions like BitLocker, FileVault (Mac OS X), TrueCrypt.
CPU AES test uses only the basic x86 instructions, and it’s hardware accelerated on VIA PadLock Security Engine capable VIA C3, VIA C7 and VIA Nano processors; and on Intel AES-NI instruction set extension capable processors. The test is HyperThreading, multi-processor (SMP) and multi-core (CMP) aware.
Here’s where the new AES instructions in the Sandy Bridge line show their worth: the i5 2300 beats out all but its i7 sibling in this test, and even squeezes into second ahead of a generally much beefier i7 from the Nehalem line.
Regarding the CPU Hash benchmark:
This benchmark measures CPU performance using the SHA1 hashing algorithm defined in the Federal Information Processing Standards Publication 180-3. The code behind this benchmark method is written in Assembly, and it is optimized for every popular AMD, Intel and VIA processor core variants by utilizing the appropriate MMX, MMX+/SSE, SSE2, SSSE3, or AVX instruction set extension. CPU Hash benchmark is hardware accelerated on VIA PadLock Security Engine capable VIA C7 and VIA Nano processors.
Here the i5 2300 starts to fall behind a bit, mostly due to raw clock speed and number of available threads. Even so, the results are nothing to sneeze at, with our test system coming in the top 20.
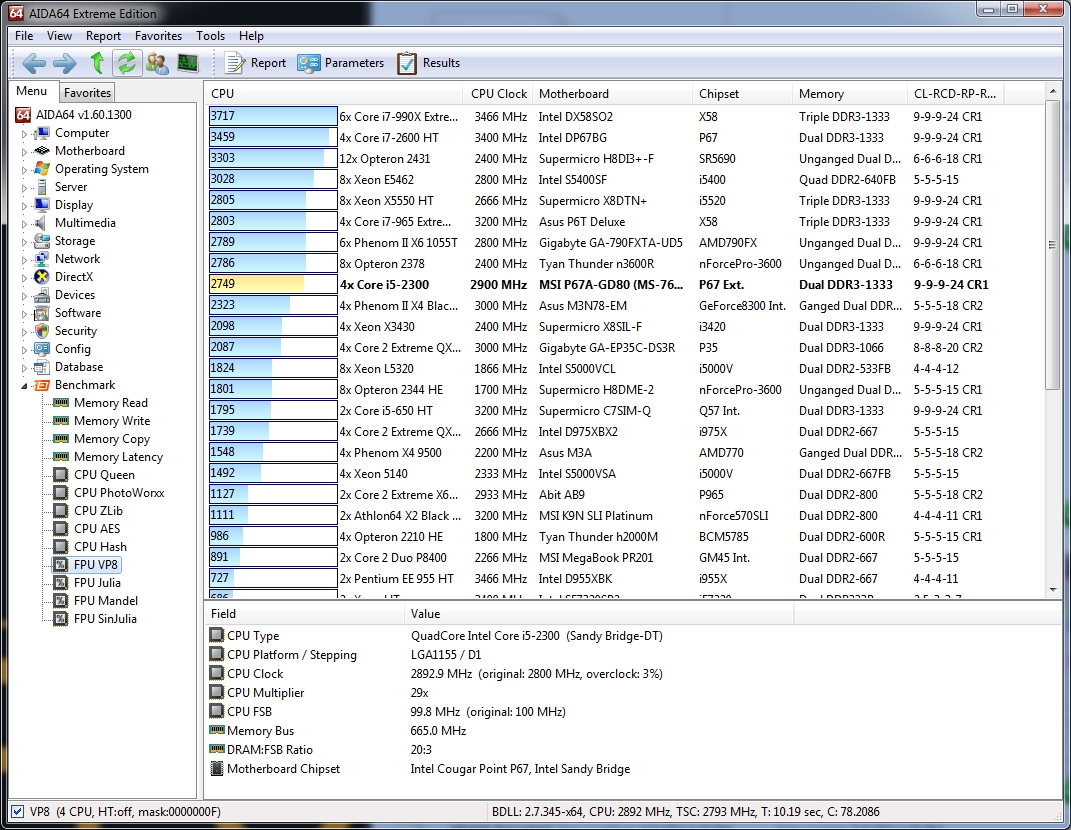
Regarding the FPU VP8 benchmark:
This benchmark measures video compression performance using the Google VP8 (WebM) video codec Version 0.9.5 (http://www.webmproject.org). FPU VP8 test encodes 1280×720 pixel (“HD ready”) resolution video frames in 1-pass mode at 8192 kbps bitrate with best quality settings. The content of the frames are generated by the FPU Julia fractal module. The code behind this benchmark method utilizes the appropriate MMX, SSE2 or SSSE3 instruction set extension, and it is HyperThreading, multi-processor (SMP) and multi-core (CMP) aware.
I’m starting to see a pattern here: our test system is smoking everything else with 4 threads, and staying competitive with the 6- and 8-thread systems.

Regarding the FPU Julia benchmark:
This benchmark measures the single precision (also known as 32-bit) floating-point performance through the computation of several frames of the popular “Julia” fractal. The code behind this benchmark method is written in Assembly, and it is extremely optimized for every popular AMD, Intel and VIA processor core variants by utilizing the appropriate MMX, MMX+/SSE, SSE2, SSSE3, or AVX instruction set extension. FPU Julia test is HyperThreading, multi-processor (SMP) and multi-core (CMP) aware.
Clearly the beefy vector execution units on the i5 2300 are serving us well, with our test system smoking every desktop processor on the market save only a handful of Intel’s finest.
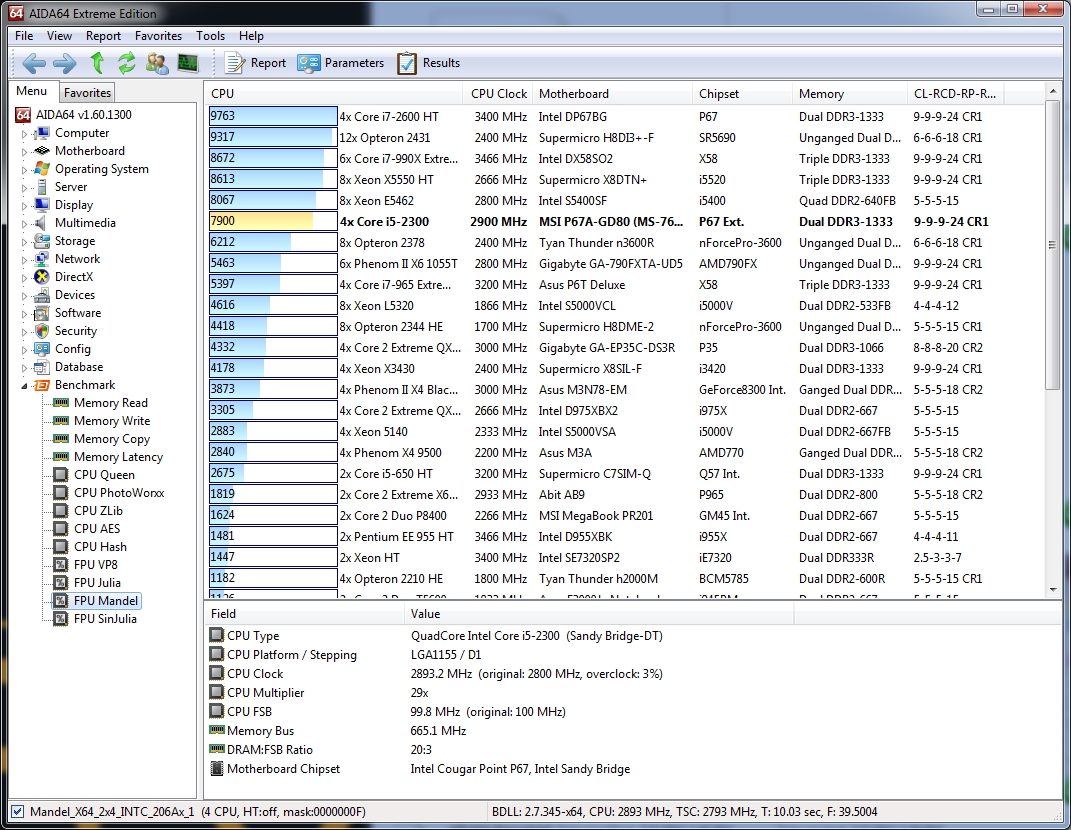
Regarding the FPU Mandel benchmark:
This benchmark measures the double precision (also known as 64-bit) floating-point performance through the computation of several frames of the popular “Mandelbrot” fractal. The code behind this benchmark method is written in Assembly, and it is extremely optimized for every popular AMD, Intel and VIA processor core variants by utilizing the appropriate MMX, MMX+/SSE, SSE2, SSSE3, or AVX instruction set extension. FPU Mandel test is HyperThreading, multi-processor (SMP) and multi-core (CMP) aware.
I’m running out of creative ways to say “beats almost every desktop CPU on the market”, but that’s a pretty good problem to have. Here the poly-threaded beasts don’t even have much of a lead.
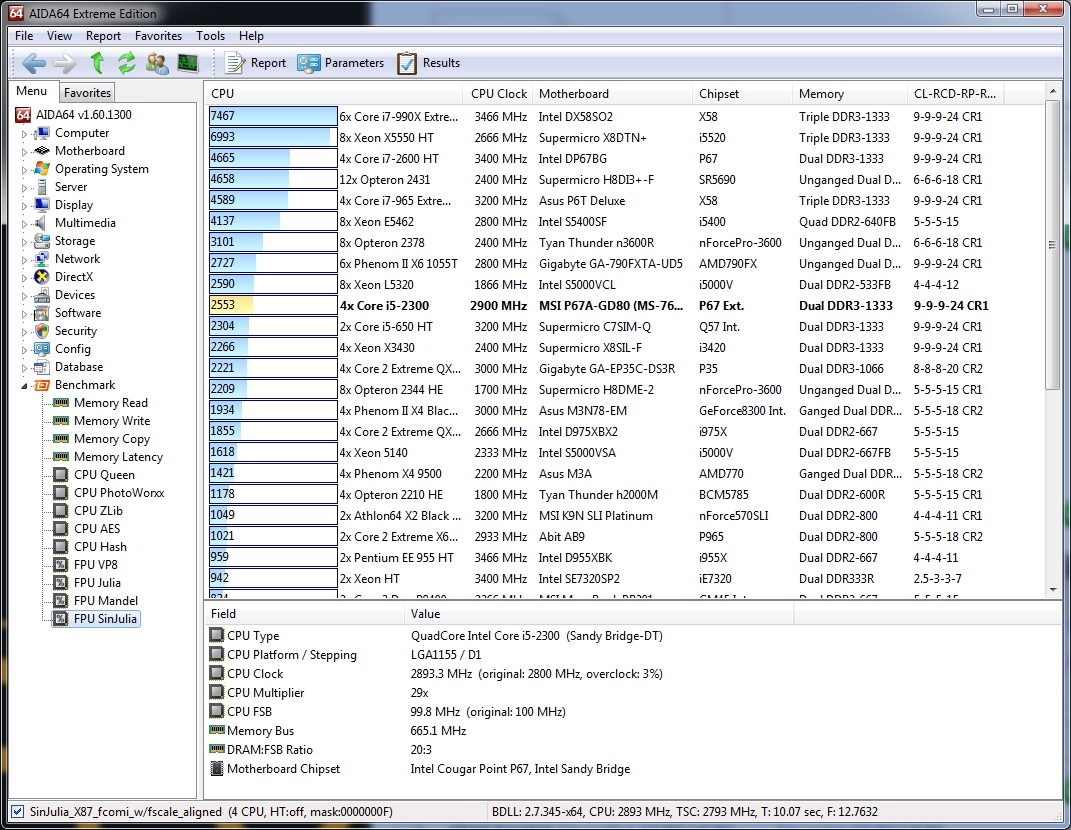
And last but not least, we have the FPU SinJulia benchmark:
This benchmark measures the extended precision (also known as 80-bit) floating-point performance through the computation of a single frame of a modified “Julia” fractal. The code behind this benchmark method is written in Assembly, and it is extremely optimized for every popular AMD, Intel and VIA processor core variants by utilizing trigonometric and exponential x87 instructions. FPU SinJulia is HyperThreading, multi-processor (SMP) and multi-core (CMP) aware.
Here’s where both clock speed and number of threads makes a difference; our test system, while still quite blisteringly fast, falls behind the rigs with more and faster logical cores.
 |
 |
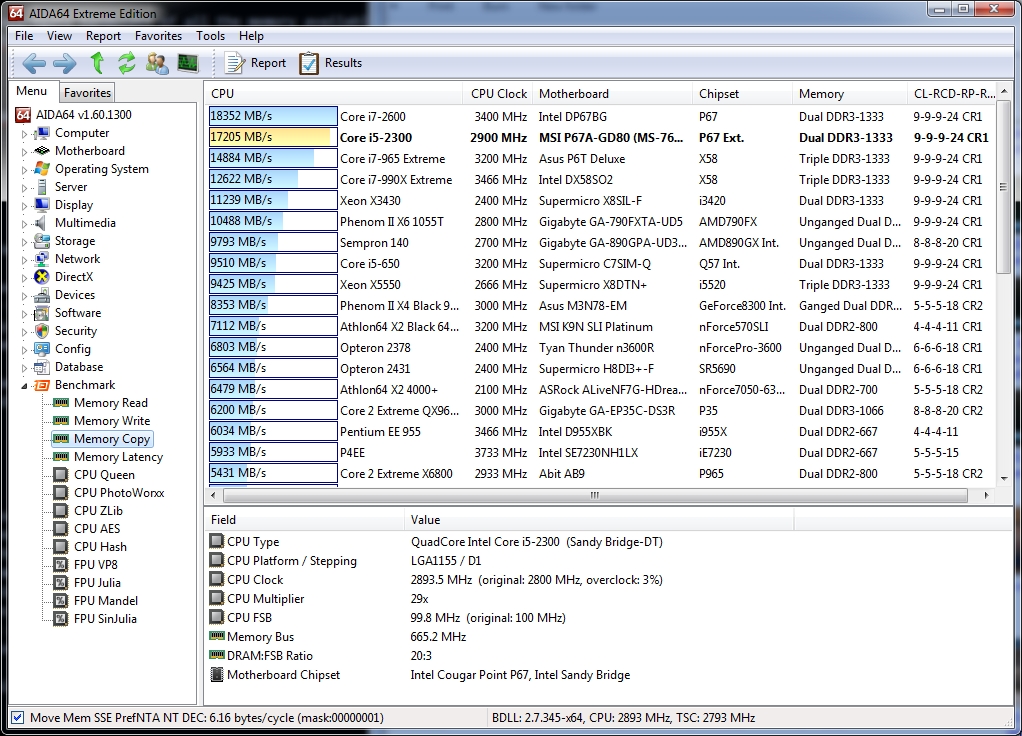 |
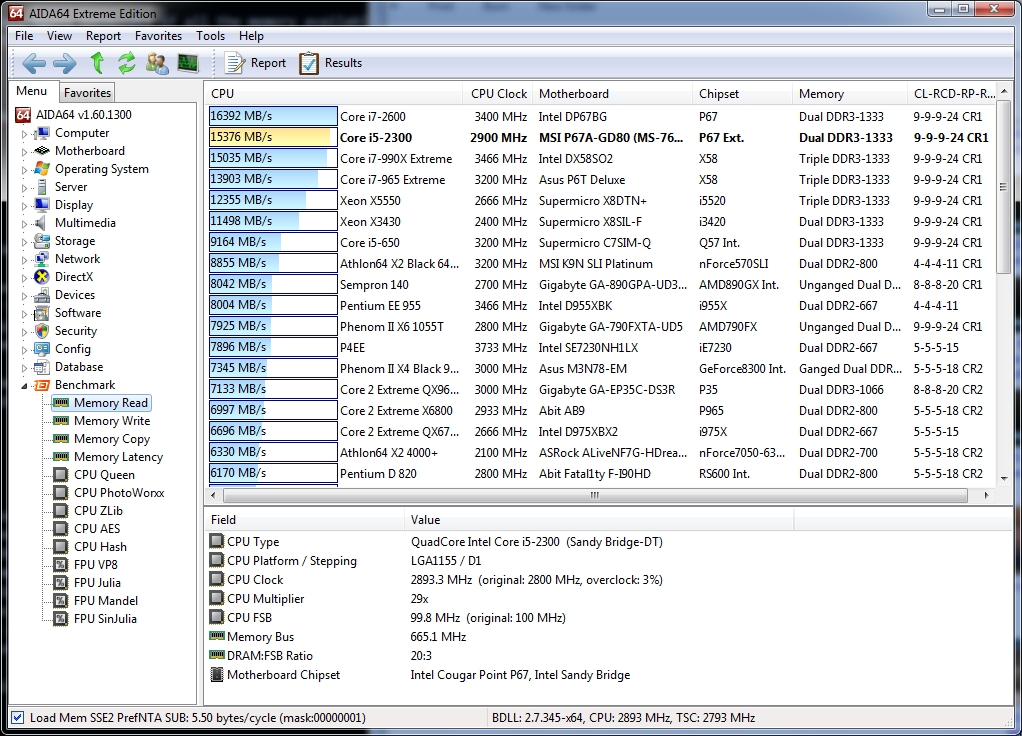
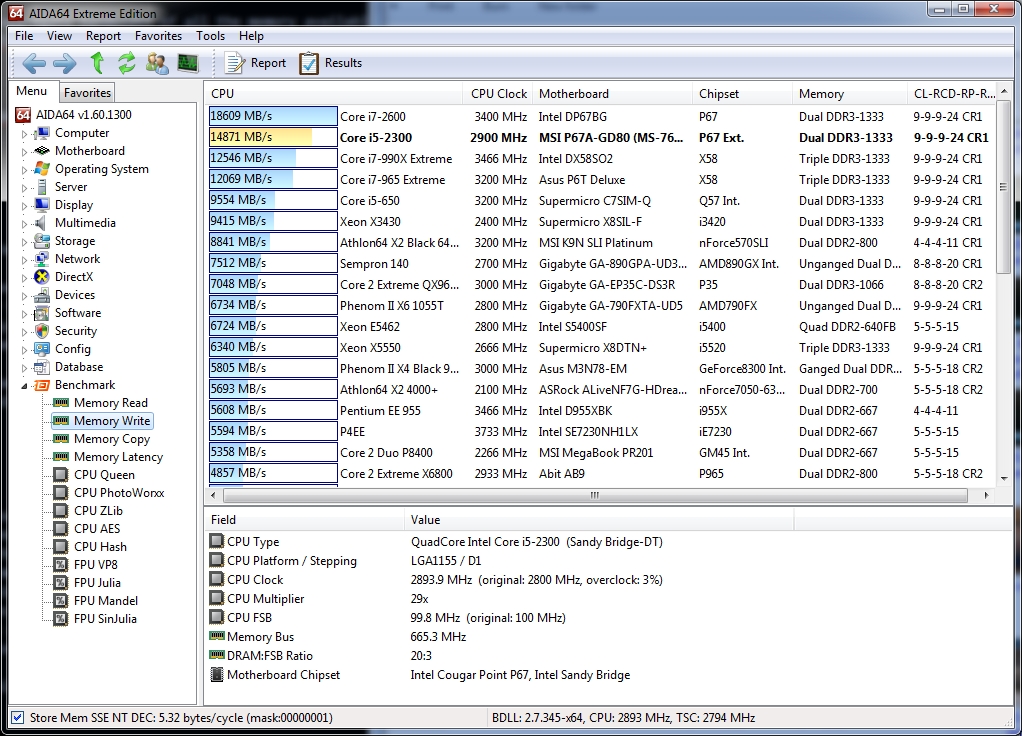
Now we’re on to the memory benchmarks; we’ll tackle Memory Read, Write and Copy as a trio:
Memory bandwidth benchmarks (Memory Read, Memory Write, Memory Copy) measure the maximum achiveable memory data transfer bandwidth. The code behind these benchmark methods are written in Assembly and they are extremely optimized for every popular AMD and Intel processor core variants by utilizing the appropriate x86, MMX, 3DNow!, SSE, SSE2 or SSE4.1 instruction set extension.
Eerily, the rankings on all three benchmarks are identical, with the i7 2600 and i5 2300 taking the top two spots. The Sandy Bridge architecture is showing some blistering throughput here.
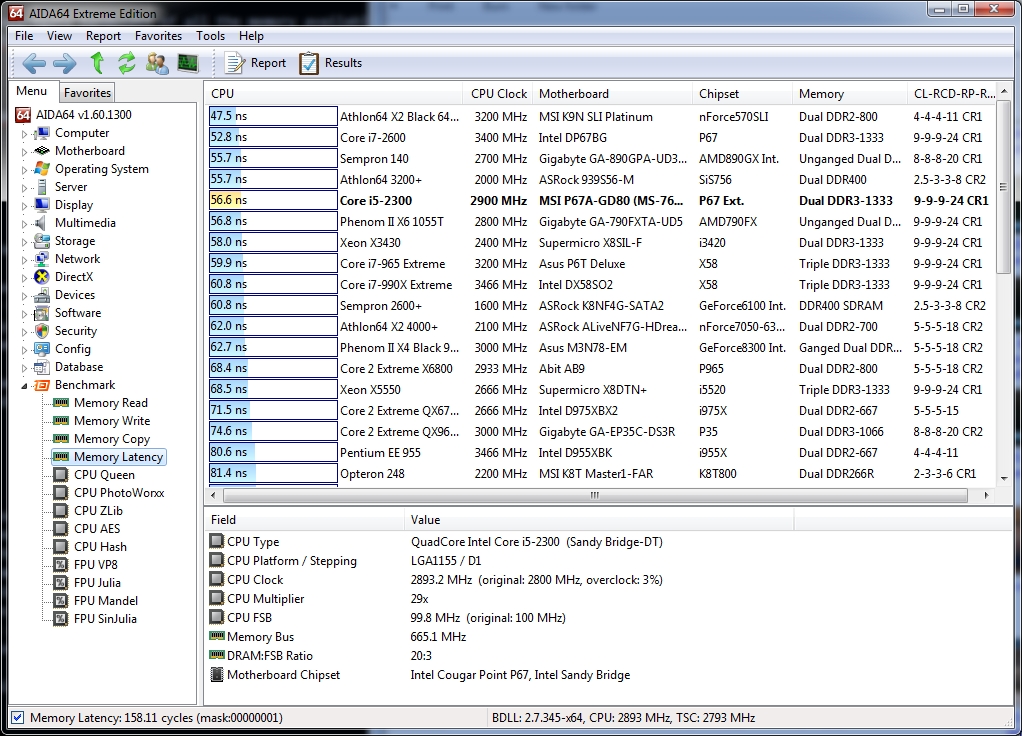
Last for this suite, we’ll take on the Memory Latency test:
The Memory Latency benchmark measures the typical delay when the CPU reads data from system memory. Memory latency time means the penalty measured from the issuing of the read command until the data arrives to the integer registers of the CPU.
Here is where the P67 chipset shows its strength: the memory latency is solidly in the top five.
PassMark PerformanceTest 7.0
Here’s another benchmark suite, PassMark’s PerformanceTest. It’s a bit more concise, but no less thorough:
Patterns from previous suites hold true here as well: top-end Nehalem CPUs beat our test system, everything else gets stomped.

While we’re not offered any direct basis for comparison here, the numbers speak for themselves: the Sandy Bridge memory controller keeps the data moving with alacrity.
PCMark Vantage
Now let’s check in with everyone’s favorite one-button suite, PCMark Vantage.
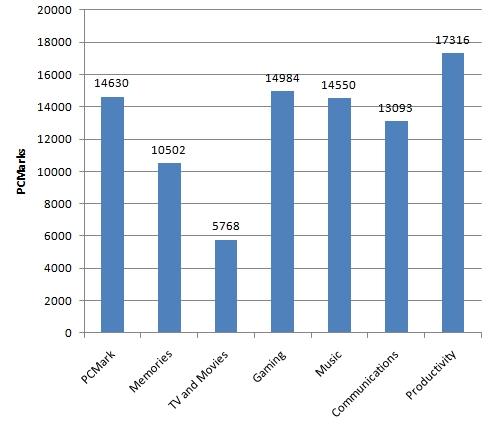
As expected, our test system scored well over the 10,000 mark in most of the tests. The TV and Movies test caused it to dip quite a bit, curiously. This doesn’t square with any of our experience with actual video, though.
3DMark Vantage
Of course, no evaluation would be complete without a run-through of PCMark’s gamer counterpart, 3DMark Vantage.
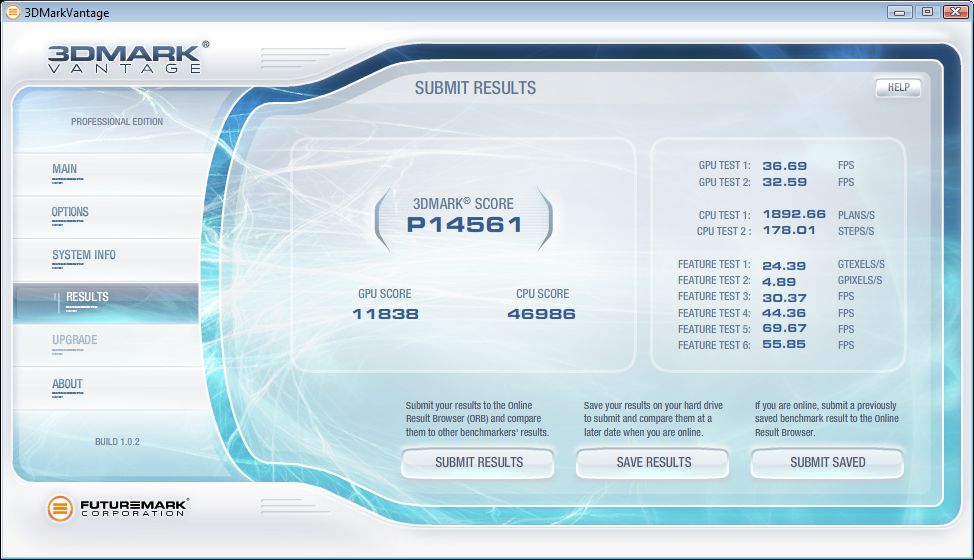
With a CPU score like this, it’s clear that if there’s any bottleneck here, it’s the GPU. Note that since this system uses a Nvidia GPU, the GPU was helping with physics tests—much as it would with any PhysX-enabled game.
Unigine Heaven
Though this involves the GPU as much as the CPU, we felt we couldn’t go without testing this setup on one of the latest DX11 benchmarks: Unigine Heaven.
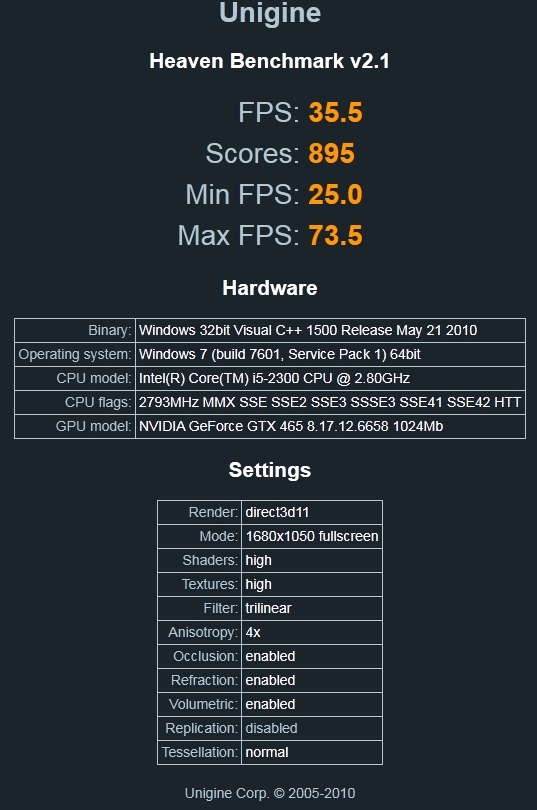
With results like these, it’s clear that the CPU isn’t holding anything back.
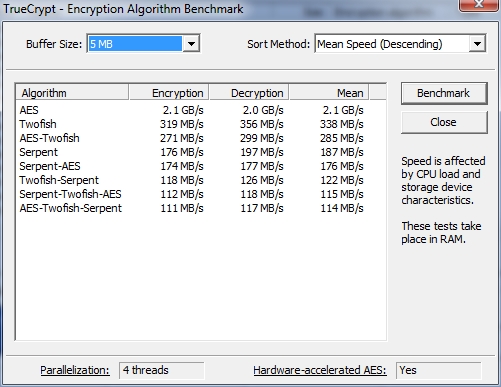
TrueCrypt
On the more practical side of things, TrueCrypt’s in-built benchmarks give us a look at how the combination of i5 2300 and P67 will benefit us in whole-disk encryption.
 |
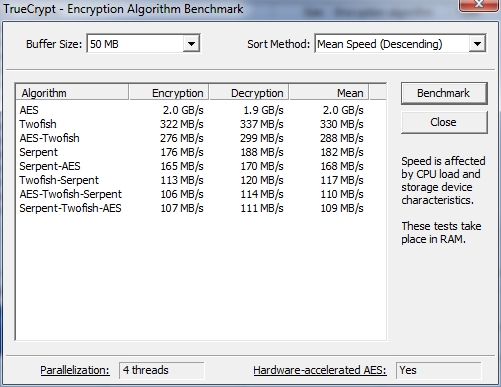 |
While the results with the other algorithms are respectable, the AES test is where this system truly shines. Intel’s AES instructions, new to the Sandy Bridge architecture, allow for a walloping fast 2GB/s throughput. Given how prevalent AES is in both encryption and compression, this is very good news.
x264 HD Benchmark
With hardware-accelerated H.264 playback in just about every mobile device with a screen coming out these days, transcoding is an activity more and more of us find ourselves engaged in. What better way to test real-world performance than to run a video sample through the most popular open-source H.264 encoder? TechARP has thrown together a benchmark that does exactly this.
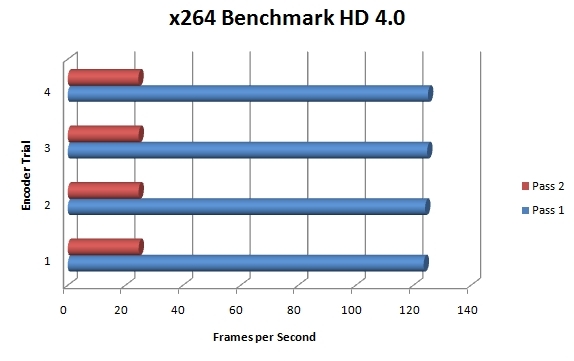
Here the results are remarkably consistent across attempts. x264 uses a two-pass approach to encoding by default: on the first pass no data is written, but estimates of average bit rate at each point in the video are stored in a temp file. On the second pass, the actual encoding happens, with those estimates used to portion out the bits as needed. For this test video, the 720p source encoded at 24.5fps on each of the four attempts—quite impressive, given how CPU-intensive the task is.
Cinebench R11.5
Aside from gaming, 3D rendering is one of the few tasks that truly stresses a modern CPU. To see how well the i5 2300 does at this task, we fired up Maxon’s Cinebench. This benchmark utility uses the same rendering engine as their Cinema4D modeling software. The benchmark can be run in multi-threaded and single-thread modes, so it’s a good way to show how parallelization can speed up compute-intensive tasks.
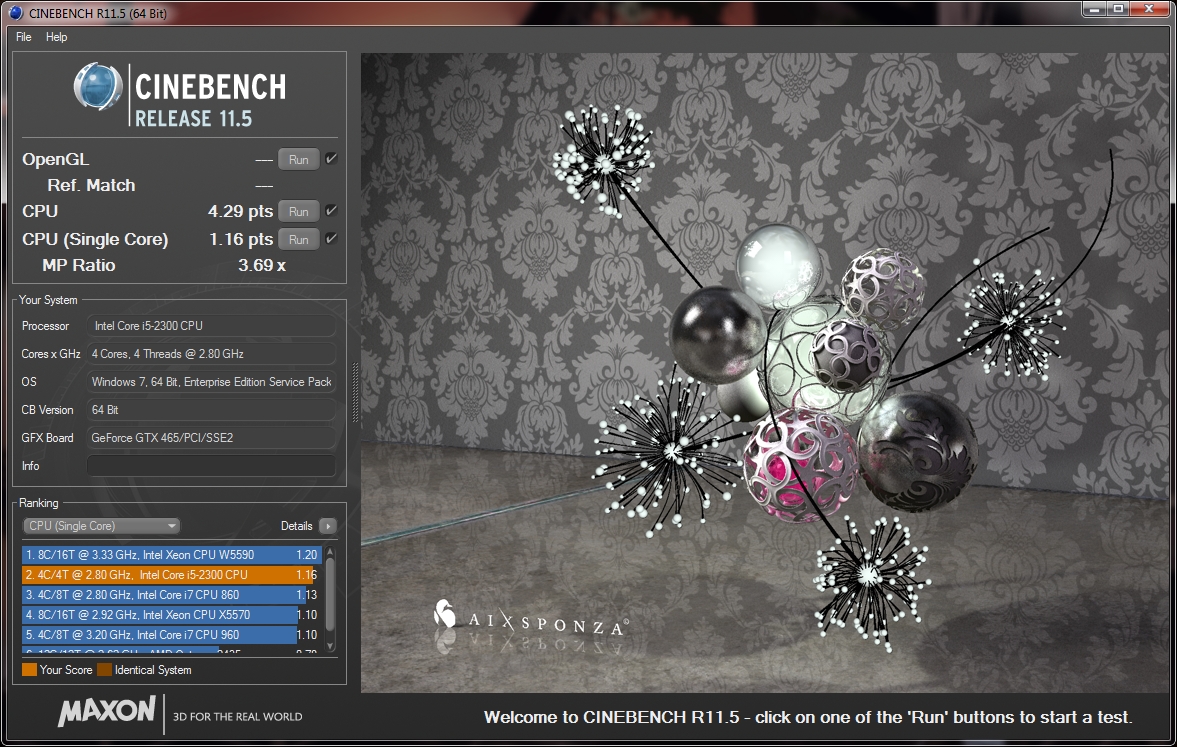
While the aggregate score of 4.29 is respectable, it’s the single-core results that are most instructive. When we focus on how much is getting done per-thread, we see that the i5 2300 is posting some phenomenal throughput, better than all but Intel’s current top-end Xeon CPU in the rankings.
Alien Versus Predator D3D11 Benchmark
Lastly, we’ll take a look at real-world gaming performance. For this we turn to the latest Alien Versus Predator game, by Rebellion Software.
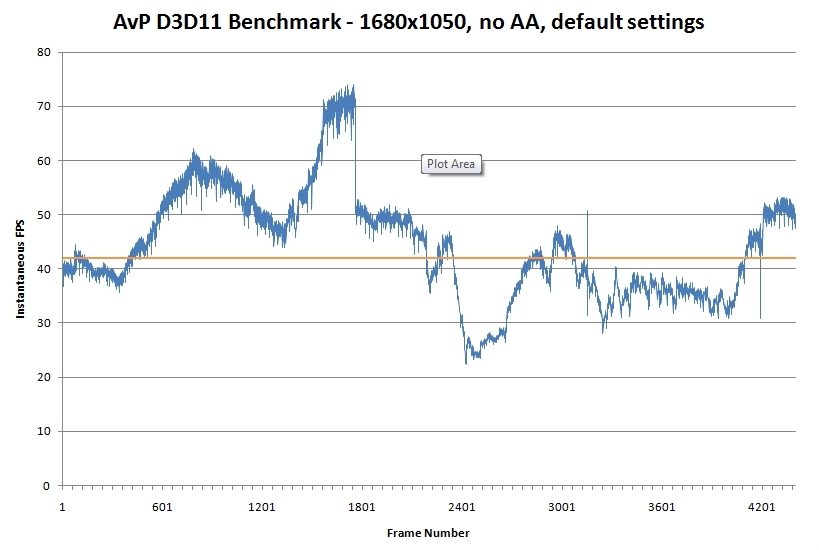
Though there were a few dips below the 30fps mark during action-intense scenes, the overall framerate is quite playable.
Thoughts and Conclusion
It’s interesting to watch the development cycles at Intel over the hardware generations. The first iteration of a new architecture generally offers some speed improvements, but it isn’t until the second generation that we start to see the real speed wins. That was the case with the Core architecture, and we’re seeing it again with the Nehalem and Sandy Bridge generations. Going into this review, I expected to see moderate improvements over the Nehalem i5’s. Instead, I got a beast that thrashes even most of the Nehalem i7 chips. With an average retail price of $185 at time of press, this chip is perfect for the power-hungry gamer whose wallet is still a bit lean.


[…] Intel Core i5-2300 CPU/Processor @ TechwareLabs […]
[…] Explorer 9: Better Than EverGamingHeaven takes on Total War: Shogun 2 (PC)TechwareLabs examines the Intel Core i5-2300 CPU/ProcessorFinally, Bjorn3D wants you to Win a GTX 590 signed by Jensen Huang and Professor Vjay PandeShare and […]