![]()
Test Rig
- Motherboard: Asus F1A75m-Pro
- APU: A8-3850
- GPU: Radeon 6670 Ultimate and onboard 6550D in Crossfire
- RAM: 4GB DDR3-2133 Kingston HyperX
- CPU Cooler: Coolermaster 140mm
- PSU: Thermaltake 700w
- Case: Coolermaster HAF 922
- Storage: 64GB Kingston SSD-Now, 500GB WD Caviar
- OS: Windows 7 Professional
Overclocking tests were performed with a 10% overclock of the APU frequency (from 100MHz to 110MHz) . Since this platform is so new to the market, I was unable to get my hands on an unlocked APU to properly test the overclocking abilities of this motherboard. The included software comes with a step-overclocking feature where I confirmed the 10% overclock.
Benchmarking
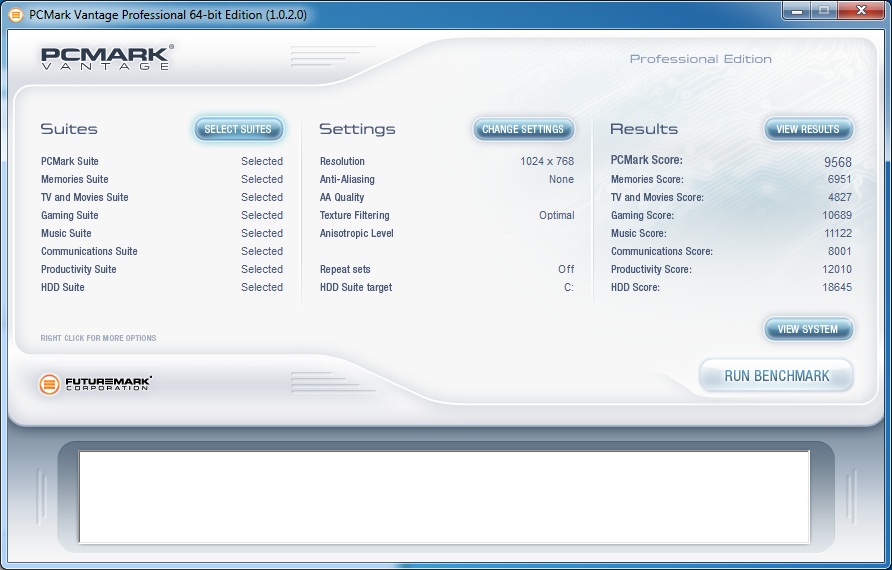
PCMark
PCMark is a benchmarking tool testing the efficiency of the computer as a whole in a gaming environment. The 7859 we achieved is comparable to stock quad-core systems. However, we notice a slight drop in CPU/GPU efficiency because of the APU altering back and forth between CPU and GPU cores. Here between the normal and overclocked tests, we see ~210 point jump which doesn’t quite reflect a 10% overclock.

normal
10% oc
Passmark Performance Test
Passmark Performance Test is also a comprehensive benchmark. Some of our results get interesting here: in the overclocked test, our CPU score jumped ~500 points but our GPU tests dropped (considerably in the 3D test). According to Passmark, our 10% overclock has actually harmed our total computers’ performance.
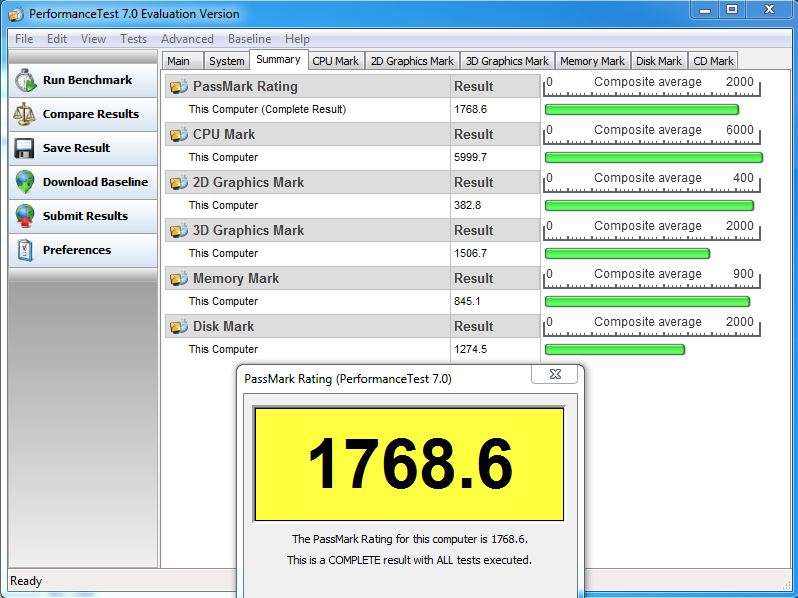
normal
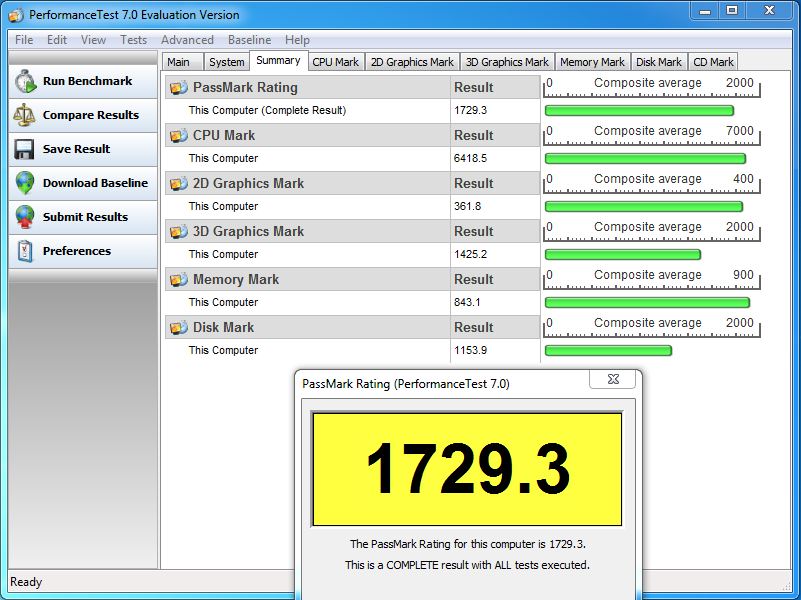
10% oc
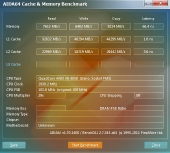
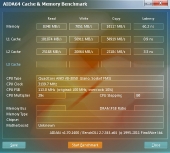
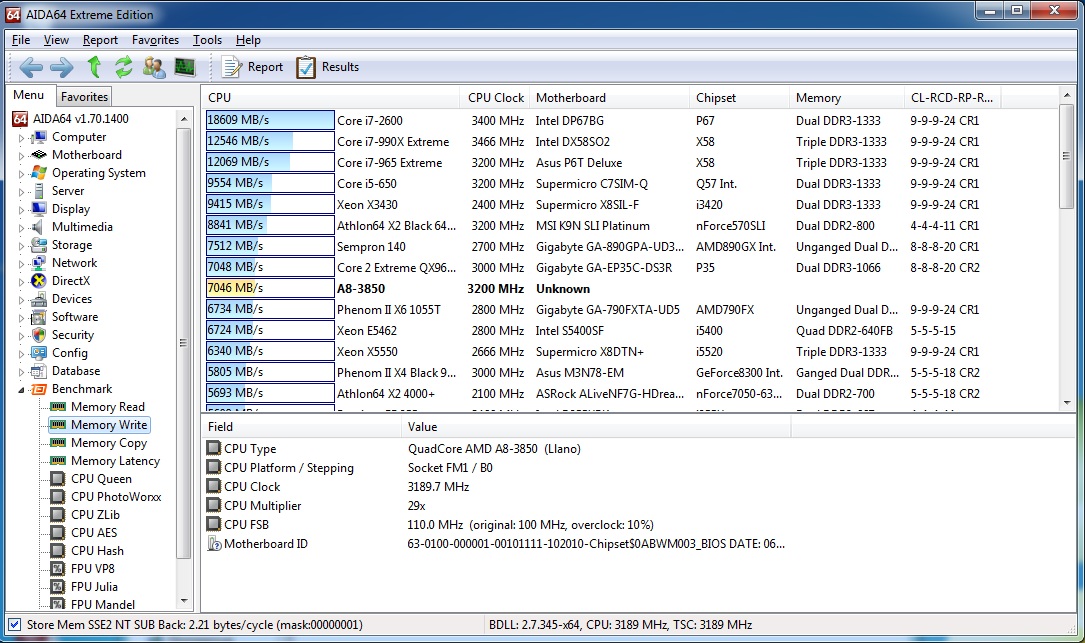
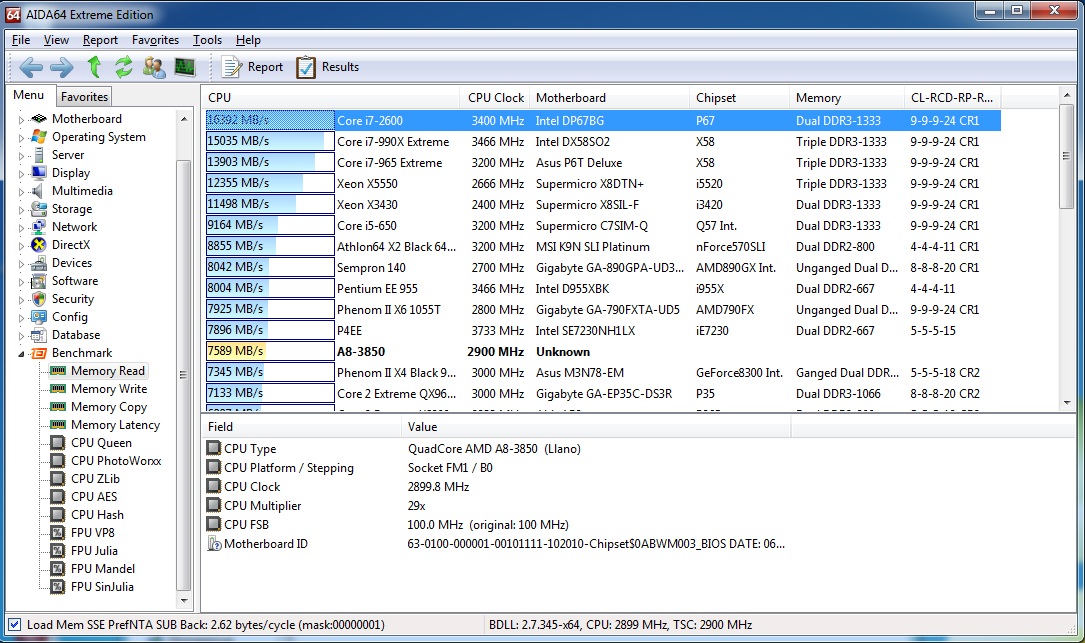
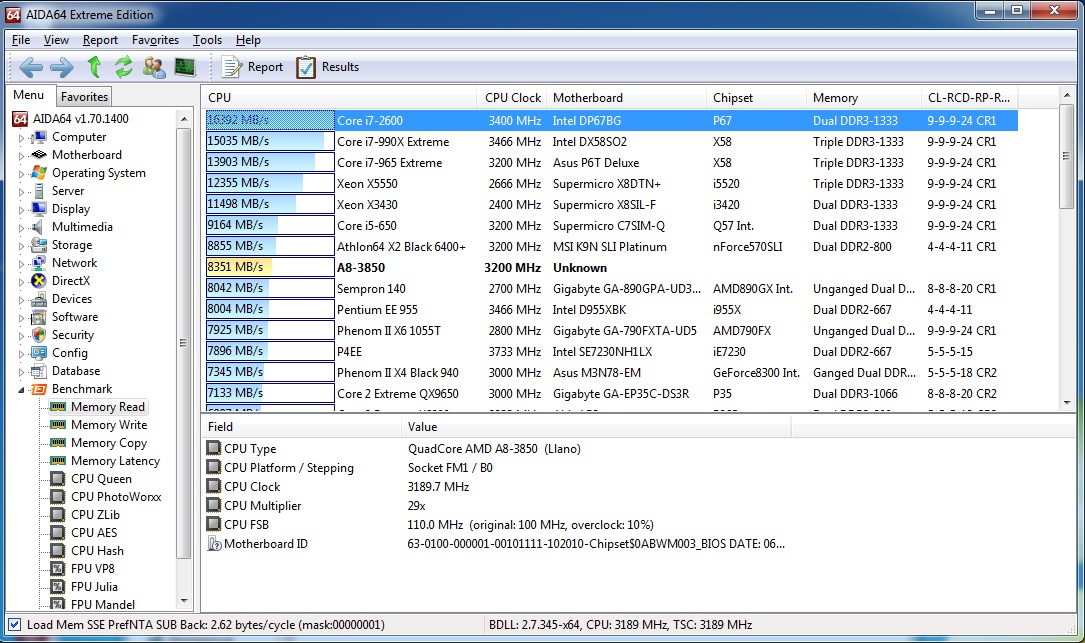
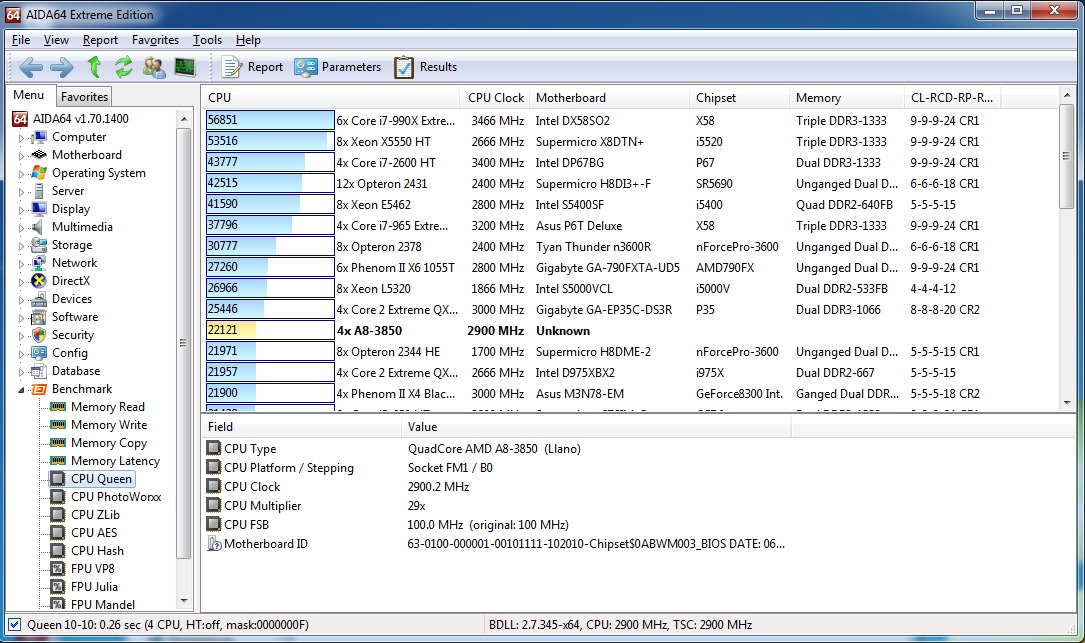
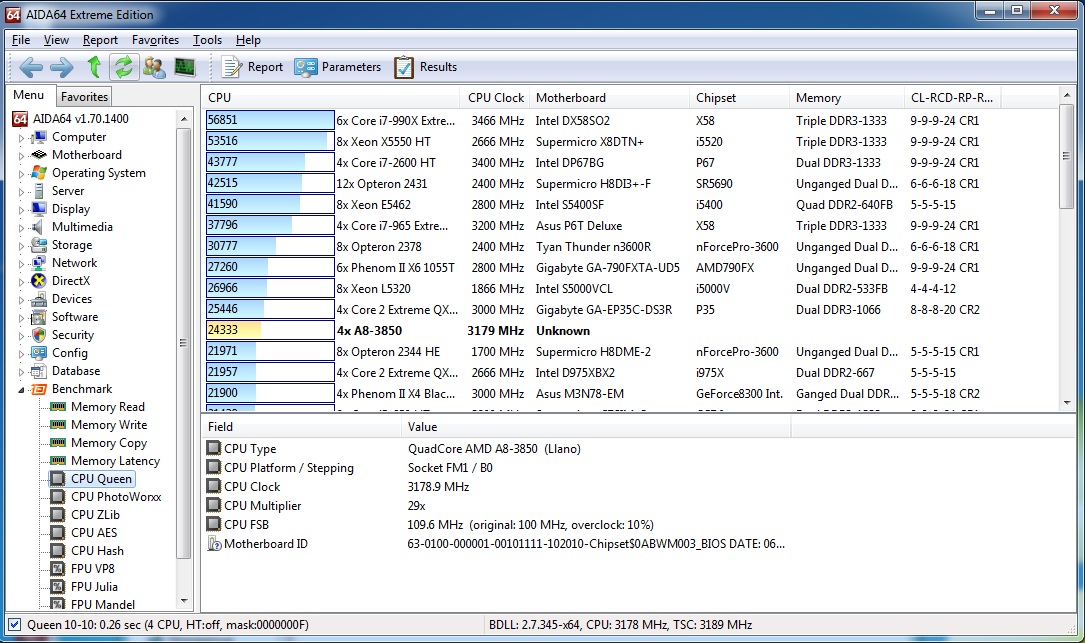
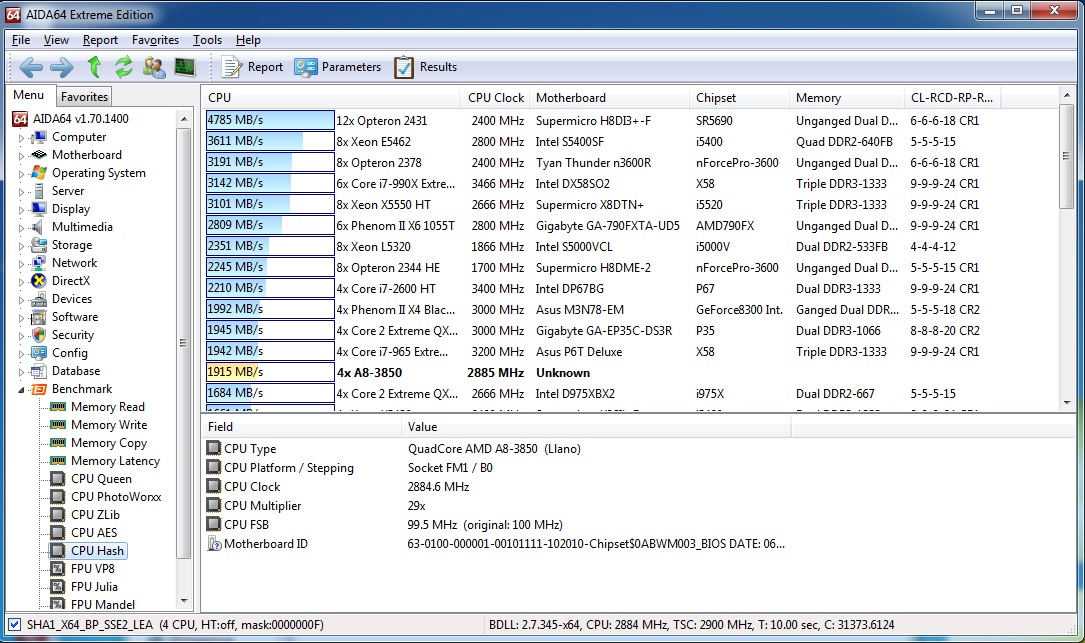
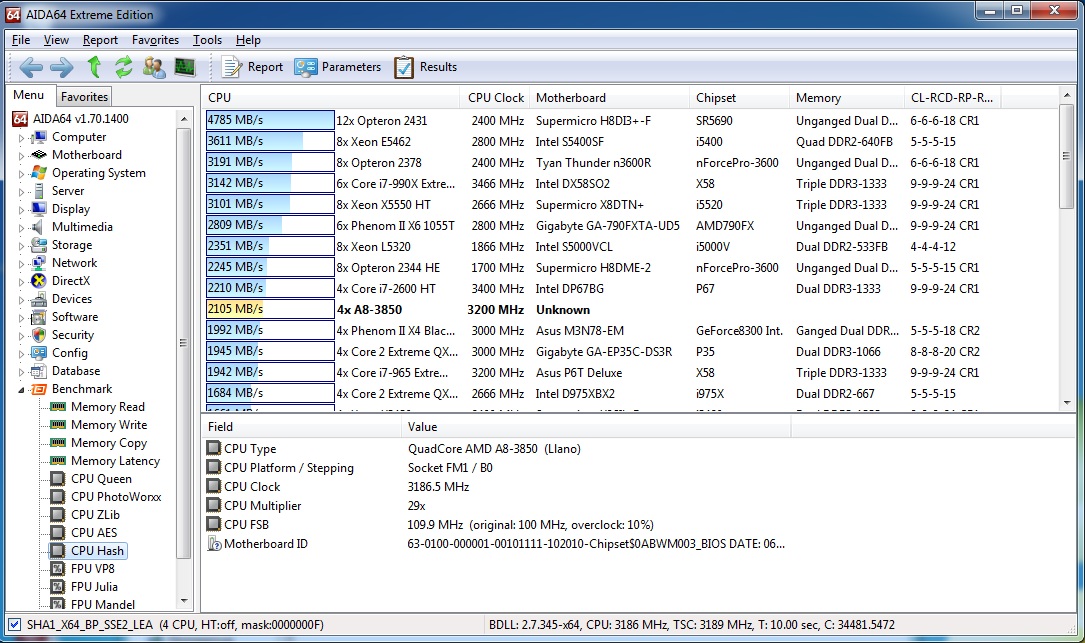
AIDA64
AIDA64 is a total-computer benchmark/sensor application and ranks them among other users so we’ll get to see an actual comparison to other rigs. Due to this chipset being so new to the market, AIDA64 is unable to find detailed information about the ram being used. I ran 4 total tests here: Memory write, Memory Read, CPU Queen, and CPU hash. Our 10% overclock can be seen in every test as ~10% jump in score. On the left column we see our normal scores and on the right we see our overclocked scores.
 |
 |
 |
 |
 |
 |
 |
 |
 |
 |
3DMark
I did the 3DMark test in a response to what we got with the PCMark score to see if our overclock has really hurt our 3D graphics score. As we can see, our overclocked score is right at that ~10%.
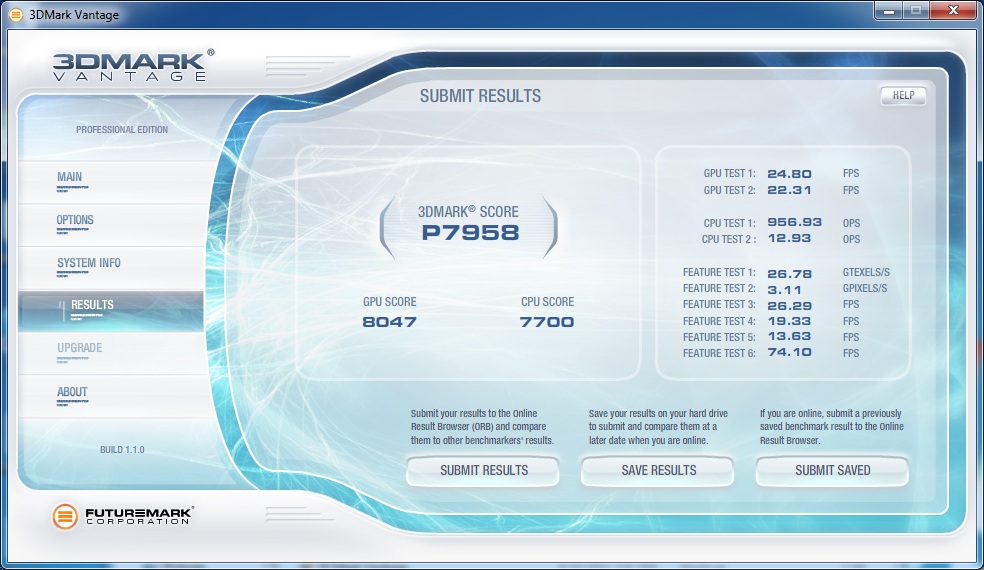
normal

10% oc