
Introduction: It’s got how many cores?
AMD just released a slew of new chips to fill in some gaps in their current line-up. Here today we have the fastest of this release, the AMD Phenom II x6 1075T 3.0GHz. This beast sits in between the existing 1055T and 1090T. This gives AMD three consumer level 6 core processors while Intel has none. And to top it all off, AMD has set these all under $300, so you can get those i7 speeds at i5 prices.
Just like the other 6-cores, the 1075T sports AMD’s new Turbo CORE system. This system is similar to Intel’s Turbo boost system, only a little bit different. With Intel’s Turbo Boost, when the processor is running below optimal power thresholds the processor will overclock 1-4 of the 4 cores to get the job done faster. AMD’s system is a little more straight forward: If the task is better suited to raw speed over multiple cores, the processor will switch from 6 cores to 3 turbocharged cores. The 1075T can go from 3.0GHz to 3.5GHz, making it one fast processor.

Descriptive Caption for Product
And now a closer look at the AMD Phenom II x6 1075T 3.0GHz.
A Closer Look
Specifications:
Phenom II™ X6 1075T Processor:
Model Number & Core Frequency: X6 1075T / 3.5GHz (Turbo) / 3.0GHz (Base)
OPN: HDT75TFBK6DGR
L1 Cache Sizes: 64K of L1 instruction and 64K of L1 data cache per core (768KB total L1 per processor)
L2 Cache Sizes: 512KB of L2 data cache per core (3MB total L2 per processor)
L3 Cache Size: 6MB (shared)
Total Cache (L2+L3): 9MB
Memory Controller Type: Integrated 128-bit wide memory controller *
Memory Controller Speed: Up to 2.0GHz with Dual Dynamic Power Management
Types of Memory Supported: Unregistered DIMMs up to PC2-8500 (DDR2-1066MHz) -AND- PC3-10600 (DDR3-1333MHz)
HyperTransport 3.0 Specification: One 16-bit/16-bit link @ up to 4.0GHz full duplex (2.0GHz x2)
Total Processor-to-System Bandwidth: Up to 37.3GB/s total bandwidth [Up to 21.3 GB/s memory bandwidth (DDR3-1333) + 16.0GB/s (HT3)]
Up to 33.1GB/s total bandwidth [Up to 17.1 GB/s memory bandwidth (DDR2-1066) + 16.0GB/s (HT3)]
Packaging: Socket AM3 938-pin organic micro pin grid array (micro-PGA)
Fab location: GLOBALFOUNDARIES Fab 1 module 1 in Dresden, Germany (formerly AMD Fab 36)
Process Technology: 45-nanometer DSL SOI (silicon-on-insulator) technology
Approximate Die Size: 346mm2
Approximate Transistor count: Similar to Istanbul’s ~904 million
Max TDP: 125 Watts
AMD Codename: “Thuban”
*Note: configurable for dual 64-bit channels for simultaneous read/writes
AMD’s New(ish) Architecture: Thuban
Earlier this year AMD released their first Thuban products, the Phenom II x6 1090T and the 1055T. These are the industries first 6-core consumer level processors. Also new with Thuban is the aforementioned Turbo CORE system to compete against Intel’s own turbo system. The 6 cores also come equipped with 6MB of L3 cache which is 2MB less than Intel’s lineup. This difference is most likely due to cost. Another cost saving statistic is AMD choice to continue with their 45nm production process. Since AMD doesn’t have to factor much miniaturization research into their prices, you get to save money.
Testing Rig:
| Motherboard | Gigabyte 890gpa-ud3h |
| Heatsink | AeroFlow FX 120 |
| Power Supply | Cooler Master Silent Pro M 600W |
| RAM | 4GB 1066MHz Geil |
| Case | NZXT Panzerbox |
| GPU | Radeon 4850 512MB |
| Harddrive | 160GB Seagate for OS; 1TB Seagate for apps |
Take note that we do not optimize our systems for the best results. We pair our review items with fair components. Sometimes they are faster than what is common, but we do try to be fair. This example is much closer to a common build. For comparison, run these benchmarks on your own machine at home.
Benchmark Testing and Analysis:
SiSoft Sandra
“SiSoftware Sandra (the System ANalyser, Diagnostic and Reporting Assistant) is an information & diagnostic utility. It should provide most of the information (including undocumented) you need to know about your hardware, software, and other devices whether hardware or software. It works along the lines of other Windows utilities, however it tries to go beyond them and show you more of what’s really going on. Giving the user the ability to draw comparisons at both a high and low-level. You can get information about the CPU, chipset, video adapter, ports, printers , sound card, memory, network, Windows internals, AGP, PCI, PCI-X, PCIe (PCI Express), database, USB, USB2, 1394/Firewire, etc.”
The latest edition of SiSoft Sandra follows the tradition of testing the pure synthetic power of processors. We ran our test comparisons as shown against equivalent processors made by both Intel and AMD. Let’s see how the AMD Phenom II x6 1075T fares against others.
 |
 |
| Arithmetic | Multi-media |
 |
 |
| Power Efficiency | Cryptography |
 |
|
| Multi-Core Efficiency | |
WinRAR
 |
 |
WinRar’s internal benchmark utility shows what the real time speed in KB/s that would be when using both single-thread and multi-threaded tasks. Looking at the results, we see that the Phenom II x6 1075T scored 808 KB/s without multi-threading and 2769 KB/s with multi-threading.
Whetstone
The Whetstone benchmark primarily measures the floating-point arithmetic performance.

The 1075T scored a wopping 3,015,591 points.
PassMark (PerformanceTest 7.0)

PerformanceTest is a great complete benchmark like PCMark Vantage.
Fast, easy to use, PC speed testing and benchmarking. PassMark PerformanceTest™ allows you to objectively benchmark a PC using a variety of different speed tests and compare the results to other computers.
PerformanceTest also gives us a CpuMark and PassMark rating. We ran PerformanceTest’s CPU benchmark which runs Mathematical operations, compression, encryption, SSE, 3DNow! instructions and more.
My rig scored a total score of 1456.2. Really good, but what really matters is the CPU score, so lets check that out.

The 1075T scored an impressive 5948.9 PassMark score, which, according to PassMark, is just over an Intel Core i7 870 2.93GHz. Not bad AMD, not bad.
Cinebench 10

 MAXON CINEBENCH runs several tests on a computer to measure the performance of the processor and graphics card under real-world circumstances and makes use of up to 16 cpus or cpu cores. Cinebench’s test process is in two-phases: The first test procedure is directed against the cpu using a 3D render scene and photo realistic image settings shown above to test how fast the cpu can produce the fully rendered scene. During the 1st pass of the test, the benchmark will only use one cpu, or in a multi-cpu core system it will use only a single cpu core to render the photo realistic scene to get a base value against which it will then perform the 2nd phase of the test using all of the cpu cores available. Higher Frames/Second and lower rendering time in seconds equals better performance.
Results
The Phenom II x6 1075T scored a remarkable 17428 points in the multi-CPU rendering test which is a 4.40x improvement over the single core result of 3962. Something different with this result is how far the speed up is from 6 times better. In the past when I’ve run this test, speedups were closer to the number of cores available.
Cinebench 11.5
CINEBENCH is a real-world cross platform test suite that evaluates your computer’s performance capabilities. CINEBENCH is based on MAXON’s award-winning animation software CINEMA 4D, which is used extensively by studios and production houses worldwide for 3D content creation. MAXON software has been used in blockbuster movies such as Spider-Man, Star Wars, The Chronicles of Narnia and many more.
CINEBENCH is the perfect tool to compare CPU and graphics performance across various systems and platforms (Windows and Mac OS X). And best of all: It’s completely free.
Main Processor Performance (CPU)
The test scenario uses all of your system’s processing power to render a photorealistic 3D scene (from the viral “No Keyframes” animation by AixSponza). This scene makes use of various different algorithms to stress all available processor cores.
In fact, CINEBENCH can measure systems with up to 64 processor threads. The test scene contains approximately 2,000 objects containing more than 300,000 total polygons and uses sharp and blurred reflections, area lights and shadows, procedural shaders, antialiasing, and much more. The result is given in points (pts). The higher the number, the faster your processor.
Results
Some great numbers showing with this test. The addition of processor comparisons to Cinebench 11 is very welcome. Now we can see that the 1075T scored very close to an i7 960 with a score of 5.32. Impressive numbers coming from AMD.
PCMark Vantage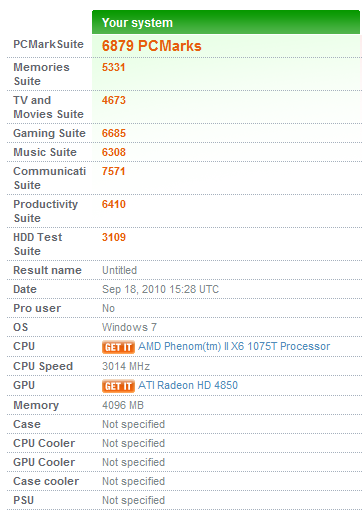
“PCMark Vantage is a PC benchmark suite designed for Windows Vista offering one-click simplicity for casual users and detailed, professional grade testing for industry, press and enthusiasts.
A PCMark score is a measure of your computer’s performance across a variety of common tasks such as viewing and editing photos, video, music and other media, gaming, communications, productivity and security.
From desktops and laptops to workstations and gaming rigs, by comparing your PCMark Vantage score with other similar systems you can find the hardware and software bottlenecks that stop you getting more from your PC.”
PCMark, tests just as the name implies, benchmarks your entire PC. It’s a great overall benchmarks which tests every aspect of your computer. It then gives a very detailed printout of what it received in the various test suites and a break down for within those sections. The suites used to benchmark the entire computer are: Memories Suite, TV and Movies Suite, Gaming Suite, Music Suite, Communications Suite, Productivity Suite, and HDD Test Suite.
Results
The 1075T scored pretty good on PCMark Vantage. PCMark doesn’t show CPU specific scores, but shows the PC as a whole. You can easily see this number rise with faster RAM, more RAM, and a faster hard drive. Nonetheless, the 1075T scored some great numbers in productivity and communications, as well as just about everything else the CPU aids in. The overall score is brought down by my RAM and hard drive.
Overclocking
In a quick test, I was able to overclock the 1075T from 3.0GHz to 3.495GHz, an 15% increase. I was able to achieve 3.6GHz, but it was unstable. This overclock was done by only increasing the bus speed, and not changing any voltages or messing with memory in AMD Overdrive. I did turn off the Turbo CORE system in the bios, just in case. With some more fine tuning, the 1075T should be able to go higher, though if extreme overclocking is what you are looking for, I recommend the 1090T, because of it’s unlocked multiplier. I used Cinebench R11 to show the performance difference because it’s a quick test that I can use to test stability.
Results
 With this 15% overclock the 1075T destroyed the Intel Core i7 960 at 3D image rendering, a task that benefits from both multiple threads and raw speed. For this image, the brighter orange is my machine, and the darker orange shows the results pre-overclock.
–~~~~~~~~~~~~–

Summary and Conclusion:
While this isn’t the fastest processor on the market, AMD has really shown what they can do. It’s clear that their goal is not to be the best, but to be the best value, and the benchmarks show what a great value this processor is. This product is very strong in many ways such as multi-threaded performance and sheer value. AMD has more physical cores than Intel, but Intel has hyper-threaded and therefore more threads, so it’s a little tough to recommend one over the other. But keep in mind, this processor costs about $239, while the cheapest i7, the 860, is $283 on newegg.com, and some of my benchmarks show that is almost as fast as an i7-960 which is $569 on newegg.com. That’s more than double the cost!
Intel and AMD both have turbo systems now. Both behave differently, but share a common bond in that over clocking occurs when the processors sees that it’s advantageous. Intel’s system seems to be better suited to all around multitasking and constant computing, while AMD seems to be going a sheer speed route. AMD also has some great over clocking potential. As stated earlier, I was able over clocked the 1075T to about 3.5GHz on air cooling, without getting to involved.
Another thing to keep in mind is RAM. AMD doesn’t support anything greater than 1333MHz even if the motherboard supports shows support, so if you want the fastest system possible Intel is going to be the way to go.
After reviewing this I did notice something rather big when it comes to gaming. I did not receive much better performance than I did with my much slower Athlon II x3 440. For those knowledgeable on the topic, this shouldn’t come as a surprise as the GPU does a large majority of the work, but for those looking to build the absolute cheapest gaming rig to play TF2 or something, an Athlon II and a decent graphics card will do just fine.
Overall, the AMD Phenom II x6 1075T 3.0GHz is a really fast processor, and it’s price is to die for. It over clocks comfortably and has AMD’s new Turbo CORE system. For anyone needing a new super fast processor, doesn’t quite need the 1090T and it’s Black Edtion goodness, but wants something faster than the 1055T, the 1075T is a great buy at $239.
TechwareLabs Relevant Reviews
|
AMD Athlon II x3 440 3.0GHz, AMD Phenom II x6 1090T |
Additional Reviews You May Like
|
AMD Phenom 1090 |

[…] & X4 970 BE & X2 560 BE Processor Review @ EOC AMD Processor Reviews @ Hi Tech Legion AMD Phenom II x6 1075T 3.0GHz Processor @ TechwareLabs AMD Phenom II X6 1075T Black Edition @ OC3D AMD CPU Refresh: 5 New Phenom II & […]