Introduction:
AMDs release on July 1st 2008 included the introduction to three new quad core processors. One of which is the 9950, which was released to fix the TLB erratum problems on the 9900. The other two released were products new to the market, the 9150e and the 9350e. While the TLB issue may have been an issue for some customers, the new B3 stepping introduced in the 9×50 series no longer has this problem.
AMD has named the new series with what they are calling their ‘9×50 series’ of processors. This makes things very easy for the consumer to identify the new cpu’s when purchasing, and identifying the new B3 stepping processors from the initial 9×00 series. Previously released AMD Phenom X4 processors are the 9550 (2.2GHz), 9650 (2.3GHz), 9750 (2.4GHz) and 9850 (2.5GHz). And newly added to the lineup is the 9150e (1.8GHz), 9350 (2.0GHz), and the 9950 (2.6GHz).
The processor we are reviewing today is the AMD Phenom X4 9950 Quad Core with the new B3 Stepping using the 65nm Silicon on Insulator process technology. This new processor is a ‘Black Edition’ and has the CPU/FSB multiplier unlocked for easier overclocking, but it has a nominal TDP of 140W making temperature control during overclocking very critical. We have also noticed that the 9950 processor has a faster 2.0GHz memory controller, making it among the best of the other ‘9×50 series’ processors that retain the slower 1.8GHz or 1.6GHz memory controller.
CPU Specifications (New AMD Phenom X4):
| Processor Model / Frequency: | X4 9950 / 2.6GHz
X4 9350e / 2.0GHz X4 9150e / 1.8GHz |
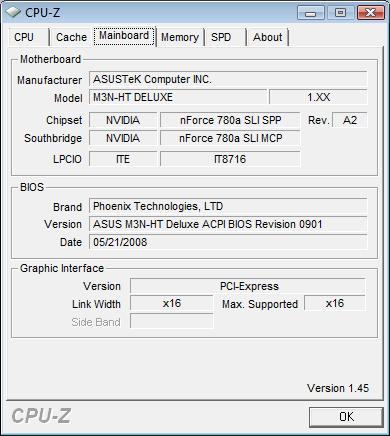
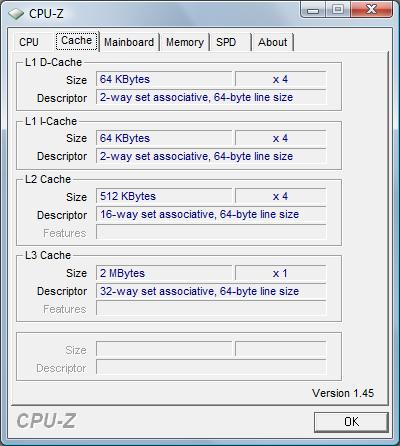
| L1 Cache Sizes: | 64K of L1 instruction and 64K of L1 data cache per core (512 KB total L1 per processor) |
| L2 Cache Sizes: | 512KB of L2 data cache per core (2MB total L2 per processor) |
| L3 Cache Size: | 2MB (shared) |
| Packaging: | Socket AM2+ 940-pin organic micro pin grid array (micro-PGA) |
| Fab location: | AMD’s Fab 36 wafer fabrication facilities in Dresden, Germany |
| Process Technology: | 65-nanometer DSL SOI (silicon-on-insulator) technology |
| Approximate Transistor count: | ~ 450 million |
| Approximate Die Size: | 285 mm2 |
| Memory Controller Type: | Integrated 128-bit wide memory controller * |
| Types of Memory Supported: | Support for unregistered DIMMs up to PC2 8500 (DDR2-1066MHz) |
| Memory Controller Speed: | X4 9950: up to 2.0GHz with Dual Dynamic Power Management
X4 9350e: up to 1.8GHz with Dual Dynamic Power Management X4 9150e: up to 1.6GHz with Dual Dynamic Power Management |
| HyperTransport 3.0 Specification: | X4 9950: One 16-bit/16-bit link @ up to 4.0GHz full duplex (2.0GHz x2)
X4 9350e: One 16-bit/16-bit link @ up to 3.6GHz full duplex (1.8GHz x2) X4 9150e: One 16-bit/16-bit link @ up to 3.2GHz full duplex (1.6GHz x2) |
| Total Processor Bandwidth: | X4 9950: Up to 33.1 GB/s bandwidth
X4 9350e: Up to 31.5 GB/s bandwidth X4 9150e: Up to 29.9 GB/s bandwidth |
| Max Ambient Case Temp: | X4 9950: 61 degrees Celsius
X4 9350e: 70 degrees Celsius X4 9150e: 70 degrees Celsius |
| Nominal Voltage: | X4 9950: 1.05-1.30 Volts
X4 9350e: 1.05-1.125 Volts X4 9150e: 1.05-1.15 Volts |
| Max TDP: | X4 9950: 140 Watts
X4 9350e: 65 Watts X4 9150e: 65 Watts |
|
*Note: configurable for dual 64-bit channels for simultaneous read/writes
|
|
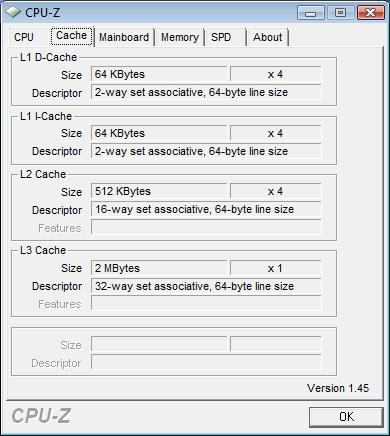
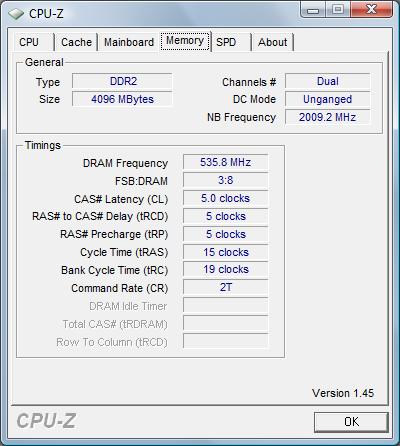
CPU-Z v1.45:
Shown below are several screen shots taken from CPU-Z, in which it properly displays all of the default settings of the new AMD Phenom 9950. You will notice that the speed 2600Mhz is formed by having a Core Speed (FSB) of 200MHz and a Multiplier of 13x, 13×200=2600, which is all achieved by powering the CPU with 1.3V. You may also notice that the AMD Phenom X4 9950 falls under the Code Name Agena, like most other Phenom X4 processors. The processor is Socket AM2+, uses the 65nm technology, and has the DR-B3 revision. By looking more closely at the screen shots below you will find out most everything you would like to know about this processor.
 |
 |
 |
 |
Overclocking:
Being part of the Black Edition family, the AMD Phenom X4 9950 has an unlocked multiplier and FSB, which will allow the user to achieve an overclock. For those readers who may not know what overclocking is, it is basically tricking your CPU to think that it is faster and then will try and perform at those speeds. Overclocking is dangerous for the particular hardware which you are overclocking, whether it be your CPU, GPU, or memory. Before you overclock you should read all of the specifications about the hardware, just to know what limitations it may have. For instance, with this processor, the nominal voltage is 1.05-1.3V, default multiplier is 13, default core speeds is 200MHz, and the MAX temp is 61 degrees Celsius. These figures are important to know so that I wont over heat the processor or give it too much voltage.

After a little while trying to find a stable overclock, i settled with 3.0GHz. This was achieved by simply increasing the multiplier to 15x, leaving the FSB at 200MHz, and slightly increasing the voltage. I was able to get the system to boot at 3.3GHz and it remained stable under the Orthos Stress test, just when i tried to run 3DMark06 it crashed, this seems as if its being under powered, but i didn’t want to increase the voltage past 1.37V. At 3.0GHz, the temperature peaked at 56 degrees Celsius. Below you can see the screen shots from CPU-Z of the overclocked processor.
 |
 |
 |
 |
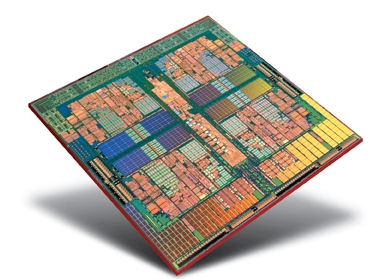
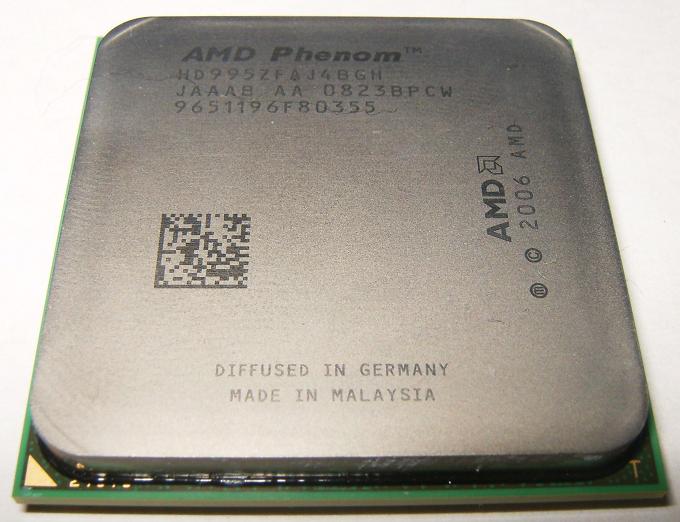
A Closer Look:
Taking a closer look at the processor itself, we notice that it looks just like every other phenom processor that we have seen.
Testing:
For our testing we are going to using the following benchmarking software:
- SiSoftware Sandra XII SP2b
- Kribi Bench v1.1
- Cinebench R10
- Winrar
- ScienceMark v2.0
- PCMark Vantage
- 3DMark06
- Gaming: Doom3
- Gaming: Half Life 2 Episode 2
For doing our testing we used the following system:
|
Motherboard: |
Asus M3N-HT Deluxe |
|
Processor: |
|
|
Graphics: |
NVidia 8800GTX |
|
Ram: |
|
|
Hard Drive: |
2x 320GB Seagate Hard Drive (Raid 0) |
|
Optical Drive: |
WriteMaster DVD Burner |
|
Power Supply Unit: |
Antec TruePower Quattro 850 Watt |
|
Operating System: |
Microsoft Windows Vista x86 Ultimate |
–~~~~~~~~~~~~–
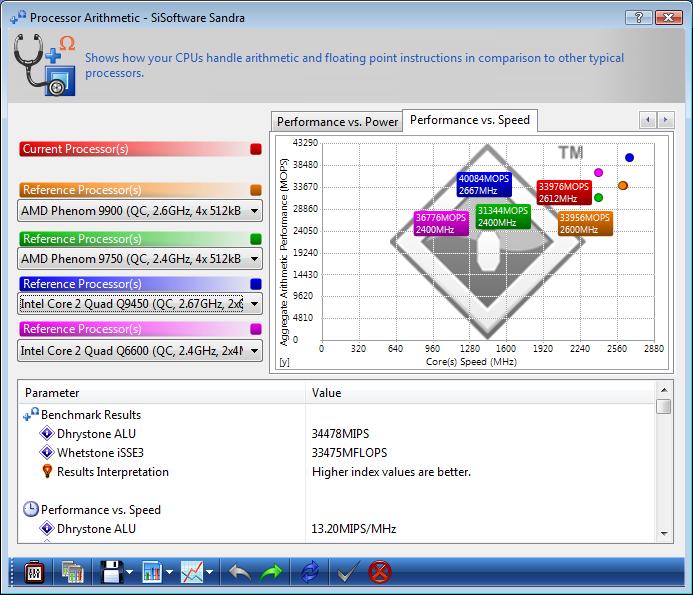
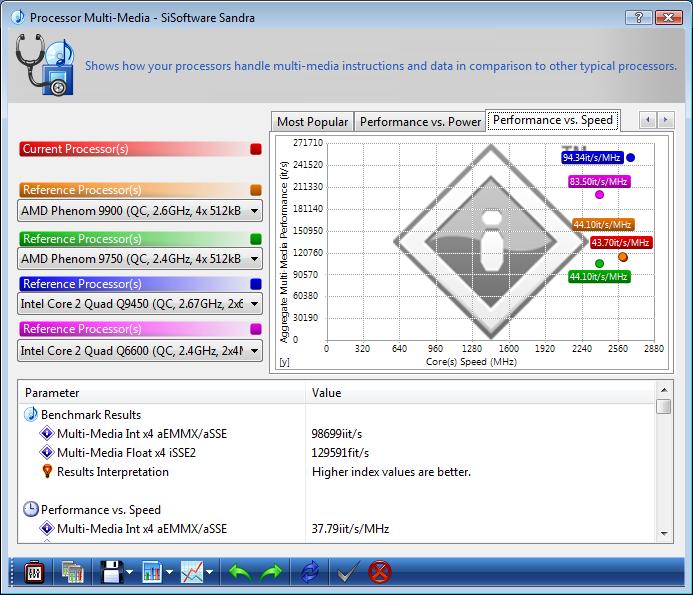
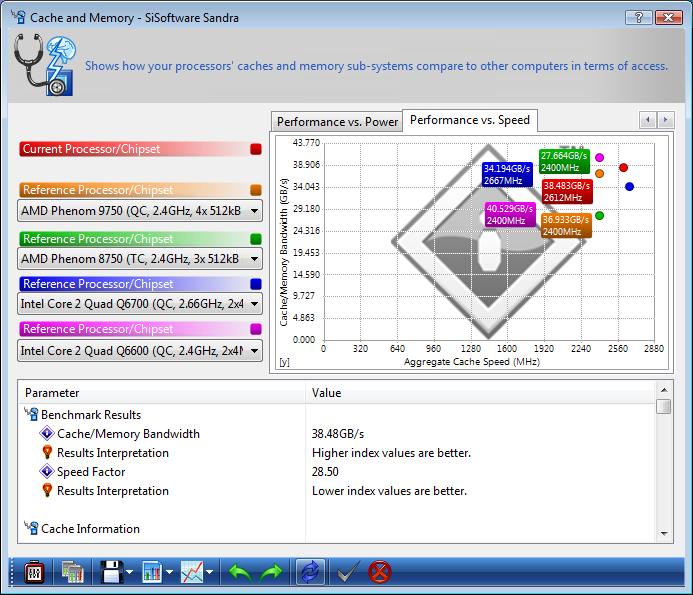
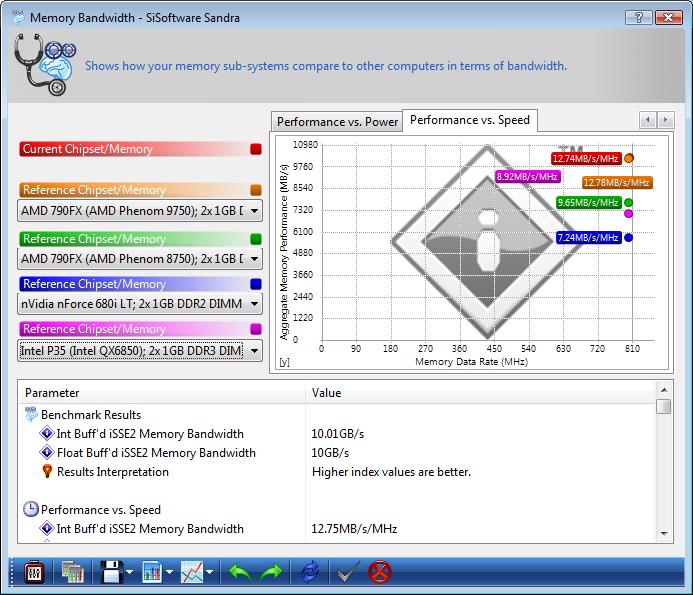
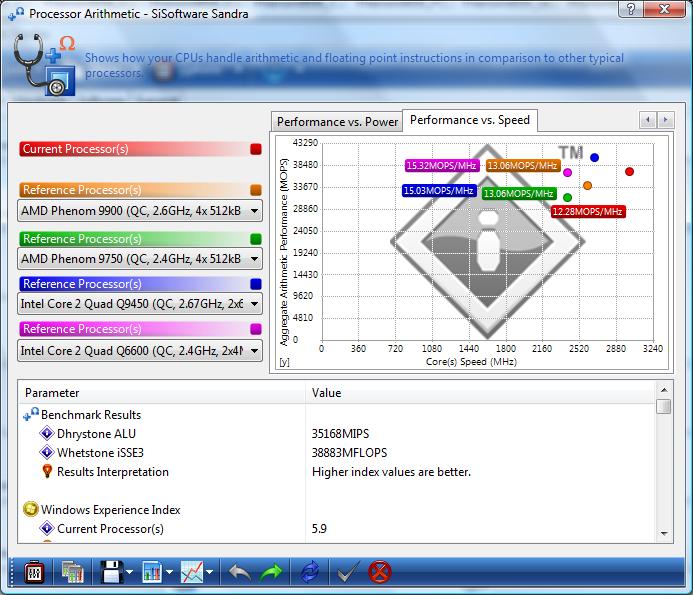
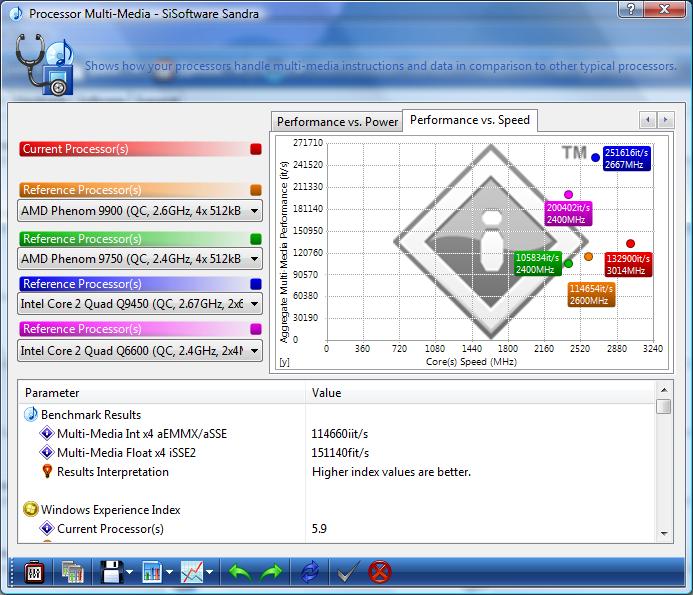
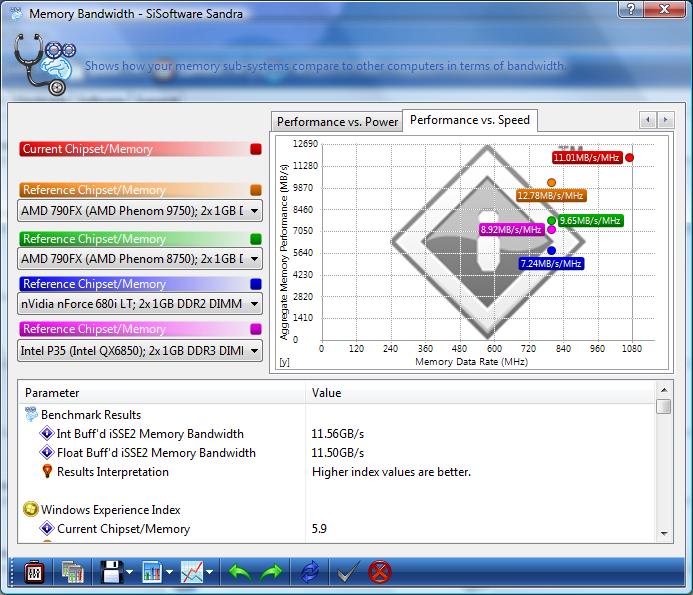
SiSoft Sandra:
“SiSoftware Sandra (the System ANalyser, Diagnostic and Reporting Assistant) is an information & diagnostic utility. It should provide most of the information (including undocumented) you need to know about your hardware, software and other devices whether hardware or software. It works along the lines of other Windows utilities, however it tries to go beyond them and show you more of what’s really going on. Giving the user the ability to draw comparisons at both a high and low-level. You can get information about the CPU, chipset, video adapter, ports, printers, sound card, memory, network, Windows internals, AGP, PCI, PCI-X, PCIe (PCI Express), database, USB, USB2, 1394/Firewire, etc.”
The latest edition of SiSoft Sandra follows the tradition of testing the pure synthetic power of processors.
We ran our test comparisons as shown against equivalent processors made by both AMD and Intel. First lets take a look at the results when running the AMD Phenom 9950 at the stock 2.6GHz clock speed.
Next we tested the overclocked configuration of the AMD Phenom 9950, which we brought to 3.0GHz.
As you can see in the results shown above. The AMD Phenom 9950 is staying neck and neck with Intel Q6600 processor. As one performs better in some tests, and the other performs better in others.

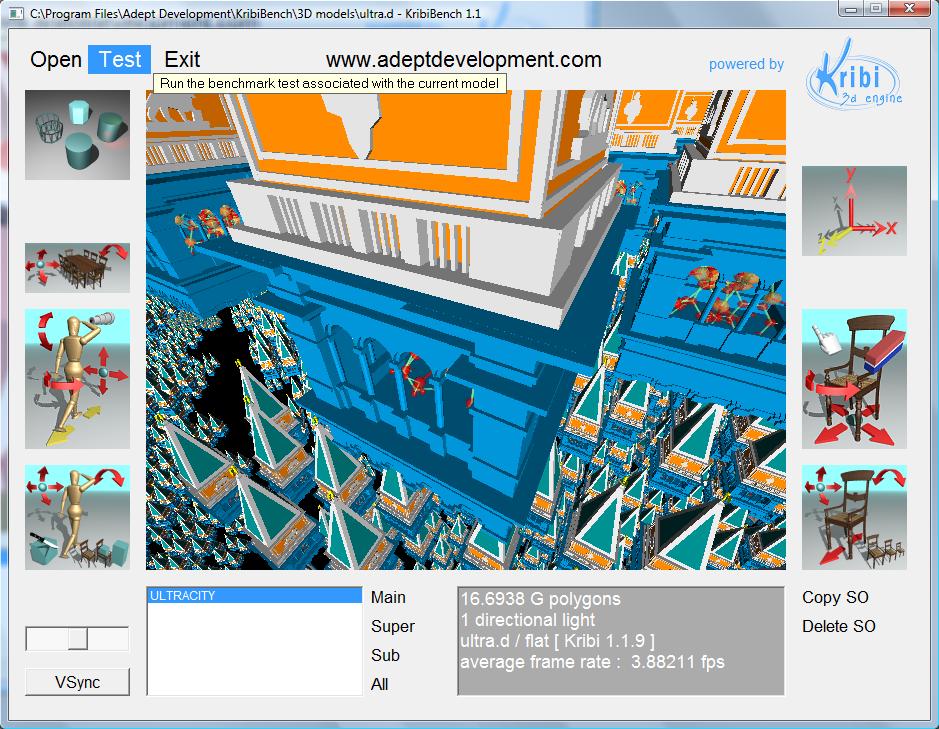
Kribi Bench v1.1
“The essential task in the final phase of the development of a 3D rendering engine, much like for a racing car engine, is tuning for the best possible performances on actual machines. After each small change in the program code, very precise timings show us the amount of speedup achieved (if any). For this purpose, we time with a stopwatch the rendering of a sequence of images, the laps of our racecourse. “
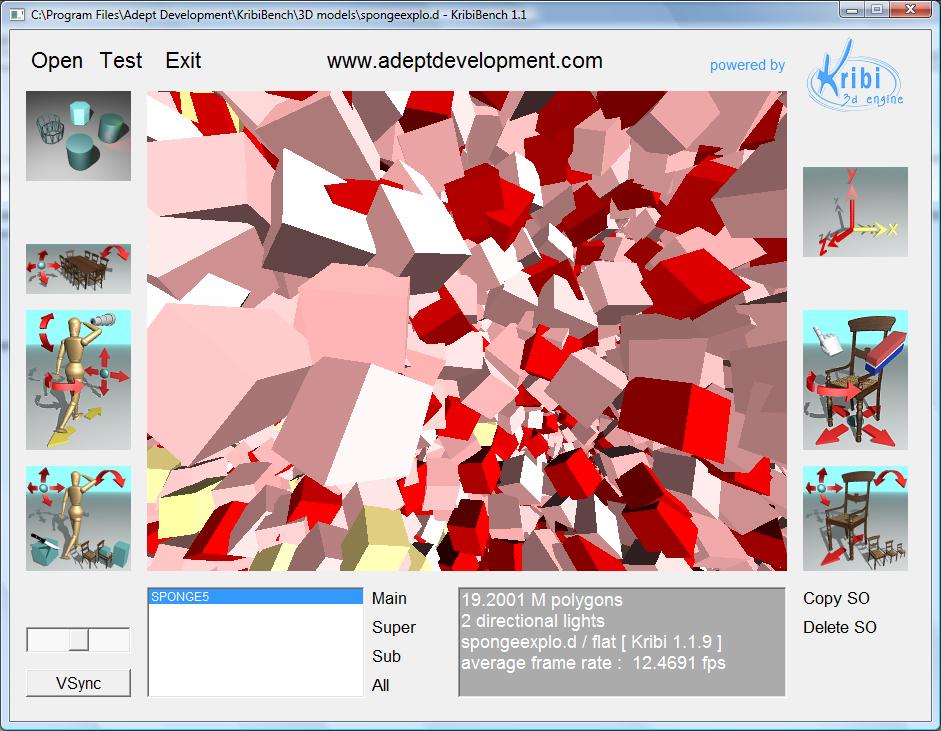
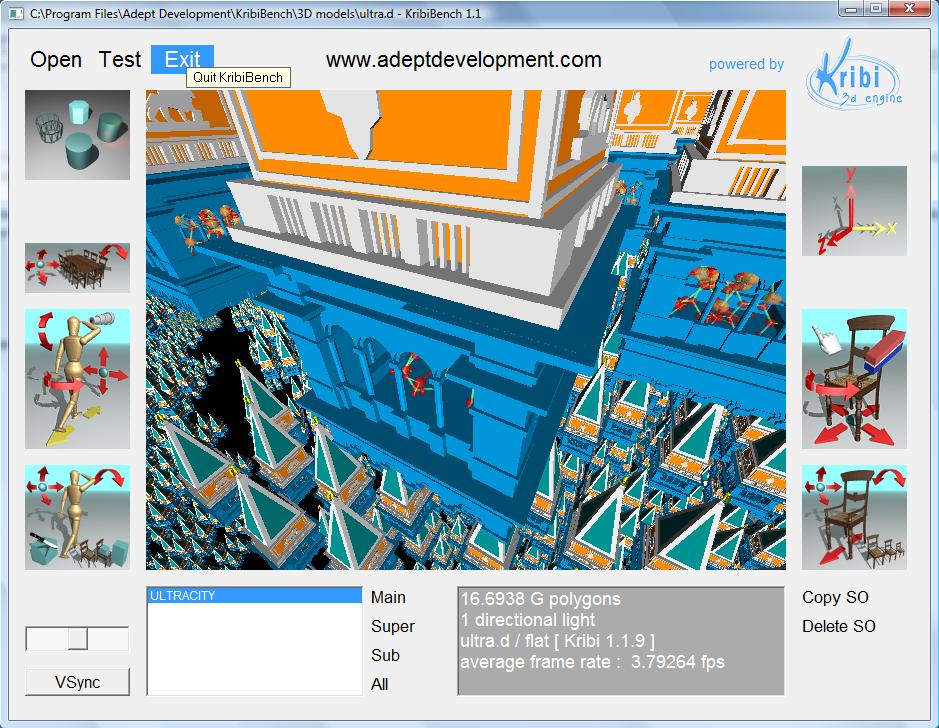
Kribi Bench is a software renderer which renders a 3D Model and reports the average frames per second. For our testing, we decided to render two of the more extensive 3D Models, both of which were included in the program. The first model we decided to render was “spongeexplo.d”, this model consisted of 19.2 million polygons, and resulted in 12.4691 frames per second. The second model we rendered was “ultra.d” consisting of 16.6 Billion polygons, which rendered at 3.79264 frames per second.
 |
 |
|
spongeexplo.d: 12.4691 fps
|
ultra.d: 3.79264 fps
|
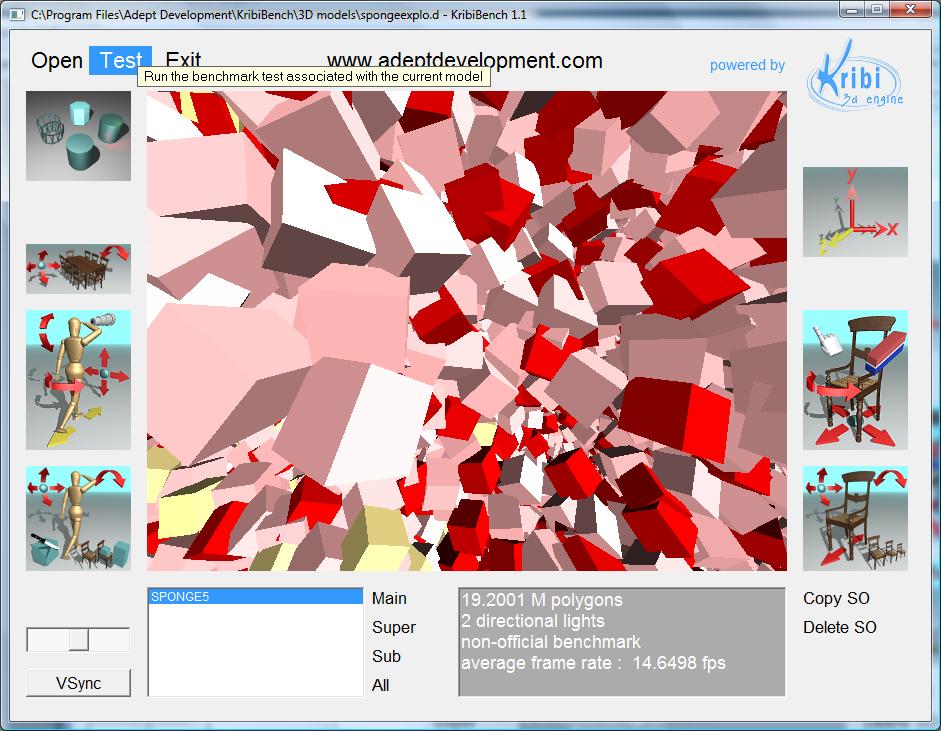
Overclocked these results increased to 14.6498 frames per second for the first model and 3.88211 frames per second for the second.
 |
 |
|
spongeexplo.d: 14.6498 fps
|
ultra.d: 3.88211 fps
|
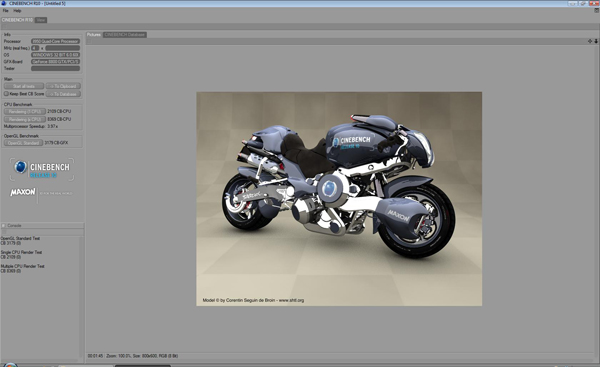
CineBench R10

MAXON CINEBENCH runs several tests on computers to measure the performance of the processor and graphics card under real-world circumstances and makes use of up to 16 cpus or cpu cores. Cinebench’s test process is in two-phases: The first test procedure is directed against the cpu using a 3D render scene and photo realistic image settings shown above to test how fast the cpu can produce the fully rendered scene. During the 1st pass of the test, the benchmark will only use one cpu, or in a multi-cpu core system it will use only a single cpu core to render the photo realistic scene to get a base value against which it will then perform the 2nd phase of the test using all of the cpu cores available. Higher Frames/Second and lower rendering time in seconds equals better performance.
Looking at the performance, you can see that for the single core phase of the test we achieved 2109 CB-CPU points. As for the second phase, which utilizes all four cores of the processor, we achieved 8369 CB-CPU points. The multiprocessor speedup reported during these tests was 3.96x when comparing the single core rendering with the multi core. This isn’t quite 4x speed up, but 3.93x is very acceptable. For the third phase of the test, it uses OpenGL to render a short clip, for this part it received 3179 CB-GFX.
 |
|
AMD Phenom X4 9950 @ 2.6GHz |
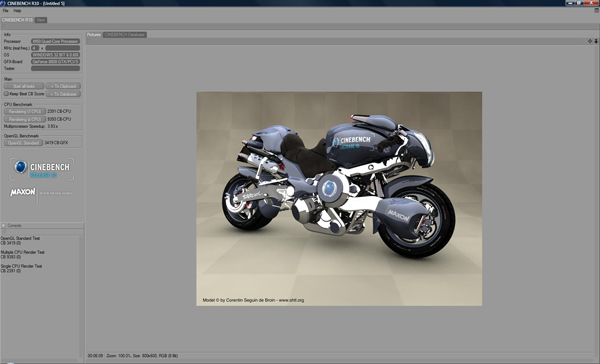
With the Phenom X4 9950 overclocked to 3.0 GHz, we were able to achieved a single core rating of 2476 CB-CPU and multi core rating of 9393 CB-CPU. This is an improvement of over 1000 CB-CPU points, which is quite a remarkable improvement. The OpenGL test improved as well, from 3179 points to 3419 points.
 |
|
AMD Phenom X4 9950 OC @ 3.0GHz
Single Core: 2391 CB-CPU
Multi Core: 9393 CB-CPU Processor Speedup: 3.93x OpenGL: 3419 CB-GFX |
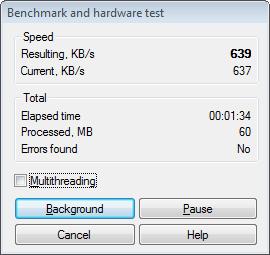
WinRar:
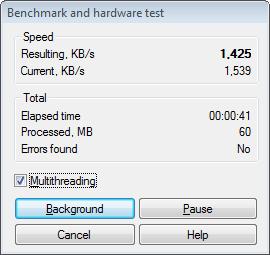
Winrar’s internal benchmark utility shows what the real time speed in KB/s that would be when using both single-thread and multi-threaded tasks. Taking a look at how the stock AMD Phenom 9950 performed, we see that without multithreading we get a resulting speed of 639 KB/s, but with multithreading enabled our speeds increase to 1,425 KB/s.
 |
 |
|
AMD Phenom X4 9950 @ 2.6GHz
|
|
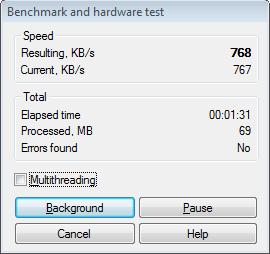
Now taking a glance on how the overclocked AMD Phenom 9950 performed, we notice that there was a significant increase in the single threading result, increasing from 639 KB/s to 768 KB/s. Whereas the multithreading results only increased from 1,425 KB/s to 1,477 KB/s.
 |
 |
|
AMD Phenom X4 9950 OC @ 3.0GHz
|
|
ScienceMark v2.0
Science Mark uses multiple benchmarking processes to get an overall idea of how the processor will perform in the real-world.
 |
 |
|
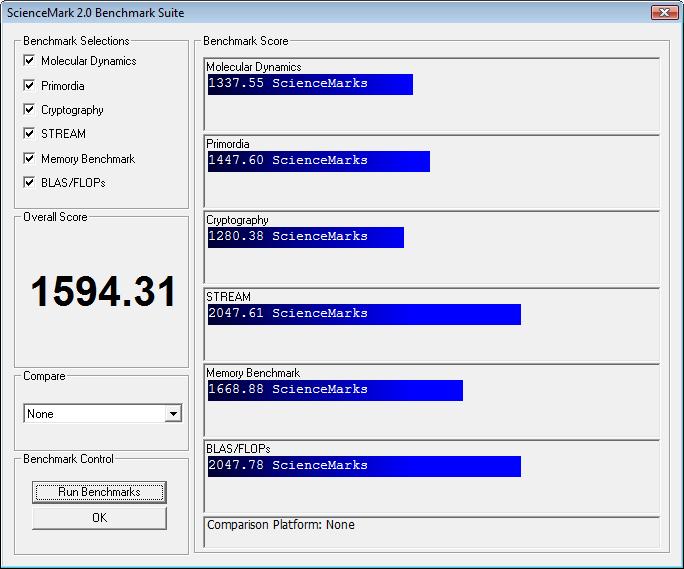
AMD Phenom X4 9950 @ 2.6GHz
|
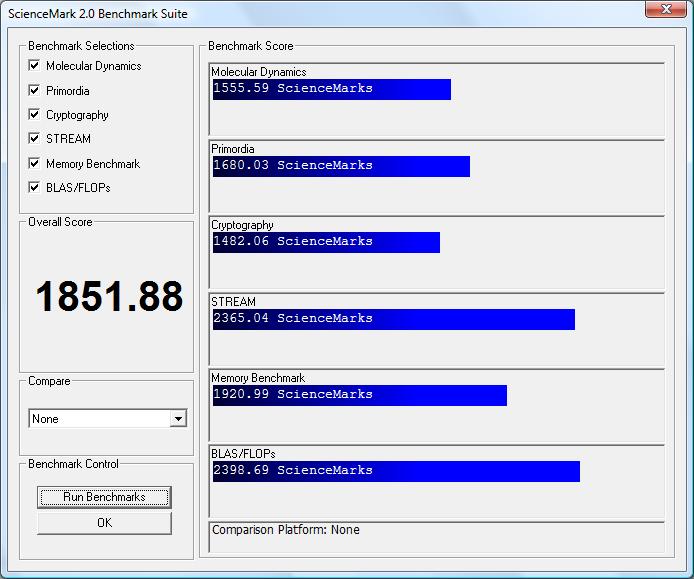
AMD Phenom X4 9950 OC @ 3.0GHz
|
As you can see from the results listed above, running the AMD Phenom 9950 at stock speeds it received 1594.31 marks. But when we bump the processor up to 3.0GHz, we received a significant improvement to 1851.88, an increase of over 250 marks.
PCMark Vantage
PCMark® Vantage is the first objective hardware performance benchmark for PCs running 32 and 64 bit versions of Microsoft® Windows Vista®. PCMark Vantage is perfectly suited for benchmarking any type of Microsoft® Windows Vista PC from multimedia home entertainment systems and laptops to dedicated workstations and hi-end gaming rigs. Regardless of whether the benchmarker is an artist or an IT Professional, PCMark Vantage shows the user where their system soars or falls flat, and how to get the most performance possible out of their hardware. PCMark Vantage is easy enough for even the most casual enthusiast to use yet supports in-depth, professional industry grade testing.
PCMark, tests just as the name implies, benchmarks your entire PC. Its a great overall benchmarks which tests every aspect of your computer. It then gives a very detailed printout of what it received in the various test suites and a break down for within those sections. The suites used to benchmark the entire computer are: Memories Suite, TV and Movies Suite, Gaming Suite, Music Suite, Communications Suite, Productivity Suite, and HDD Test Suite.

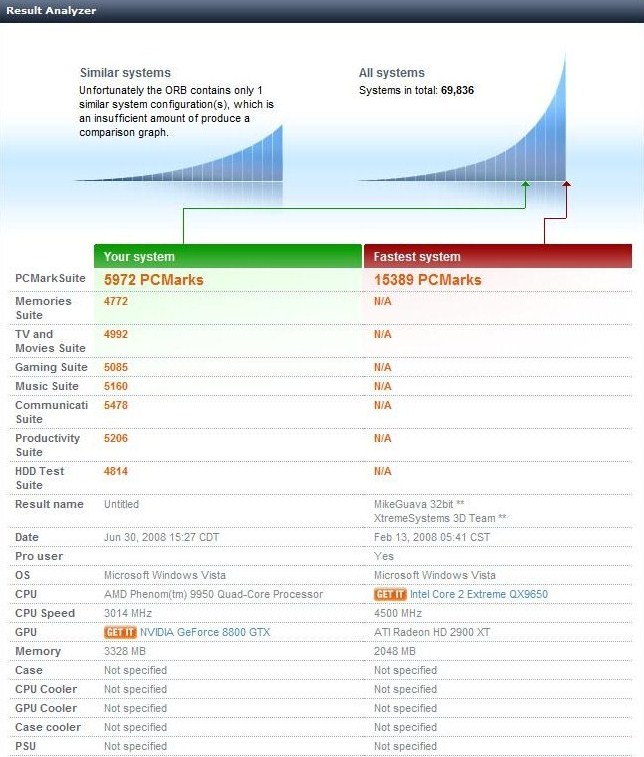
Listed above are the results of that both the stock and overclocked processor received. We can notice that when overclocked most of the suites increased between 200-600 marks, with an overall improvement of 504 marks. Thus showing that when overclocking the processor, we dont only see an improvement in gaming, but also most applications that you use on a daily basis.
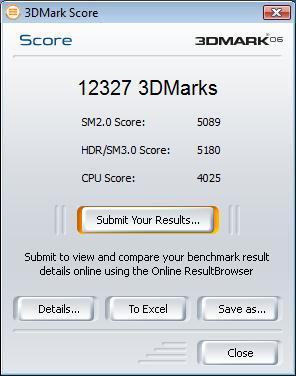
3D Mark 06
3DMark®06 is the worldwide standard in advanced 3D game performance benchmarking. A fundamental tool for every company in the PC industry as well as PC users and gamers, 3DMark06 uses advanced real-time 3D game workloads to measure PC performance using a suite of DirectX 9 3D graphics tests, CPU tests, and 3D feature tests. 3DMark06 tests include all new HDR/SM3.0 graphics tests, SM2.0 graphics tests, AI and physics driven single and multiple cores or processor CPU tests and a collection of comprehensive feature tests to reliably measure next generation gaming performance today.
3DMark tests the graphical performance of your computer, although this is mostly dependent on the graphics card installed, a good portion of the test depends on the processor. We ran the test using the AMD Phenom 9950 configured at stock settings and then overclocked to 3.0GHz. Shown below are the results of these two test configurations.
 |
 |
|
AMD Phenom X4 9950 @ 2.6GHz
|
AMD Phenom X4 9950 OC @ 3.0GHz
|
The performance on both tests were quite remarkable, running at stock speeds the AMD Phenom 9950 scored 11,675 marks overall and 3529 marks specifically for the CPU. Overclocked we were able to achieve 12,327 marks and 4025 were specifically for the CPU. This was an increase of overall 652 marks and a CPU increase of 496 marks. Also as you can see in the results above, when we overclocked the processor, the other two main test factors also improved nearly 200 marks each. Thus demonstrating that the overclock did improve the performance that we will achieve in many video games and applications.
|
HDR (High Dynamic Range) |
| High dynamic range rendering (HDRR or HDR Rendering), also known as high dynamic range lighting, is the rendering of 3D computer graphics scenes by using lighting calculations done in a larger dynamic range. Video games and computer generated movies benefit from this as it creates more realistic scenes than with the previous lighting model (referred to as “low dynamic range lighting” or “standard lighting”).
Information from Wikipedia. |
|
SM (Shader Modeling) |
| The High Level Shading Language for DirectX implements a series of shader models. Using HLSL, you can create C-like programmable shaders for the Direct3D pipeline. Each shader model builds on the capabilities of the model before it, implementing more functionality with fewer restrictions.
Shader model 1 started with DirectX 8 and included assembly level and C-like instructions. This model has many limitations caused by early programmable shader hardware. Shader model 2 and 3 greatly expanded on the number of instructions, and constants shaders could use. They are much more powerful than shader model 1, but still carry some of the existing limitations of the first shader model. Information from MSDN. |
Doom 3

About Doom 3:
Very similar to previous versions of Doom, you play an anonymous marine who was sent to a base on mars for a routine mission. Scientists on the base were exploring a set of ruins where they made a discovery of a set of tablets. On these tablets were records that the martians once found a type of teleportation device that lead to hell. Finding this out too late, the development was invaded by demons, and you find yourself forced to fight your way to safety.
Benchmarking Doom 3:
Before we talk about how we are going to benchmark Doom 3, lets first define some programs and features we will be taking advantage of.
| FRAPS: A benchmarking tool that records the FPS of your active window, namely Doom 3, and adds that information to a spreadsheet. Once finished recording it will tell you the minimum, maximum, and average frames per second of what it was recording. |
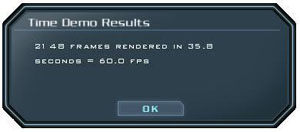
| Time Demo: A pre-recorded set of data recorded from true game play. The time demo will be replayed by the game engine as if you are playing it your self, it will then time how long it takes the render the entire record. At the conclusion of the test it will report the number of frames rendered, how long it took to render, and the average frames per seconds. |
Since benchmarking our actual game play will produce a different result each time, we decided to use a timedemo. Using this timedemo will produce results that make the comparison between different products easy and accurate. Luckily, Doom 3 comes with a pre-recorded timedemo called “Demo1”, in order to run this demo you must first open the command prompt by pressing and holding Ctrl, Alt, ~, once open type “timedemo <Demo_Name>”. Thus said, we will be using both the built in benchmark and fraps to benchmark the timedemo to try and get an accurate reading.
Benchmark Results:
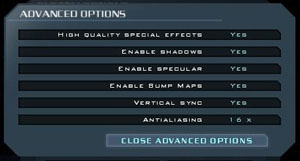
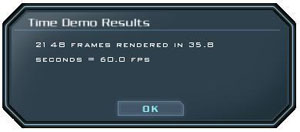
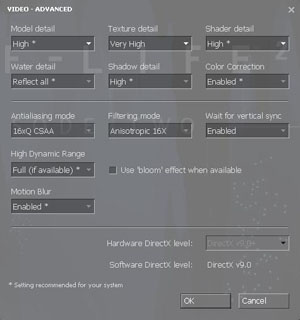
For Doom 3, we decided to max out the settings, which can be seen in the two following pictures. It was set to Ultra High Quality with a resolution of 1600×1200 with 16x Antialiasing.

Like all of the other benchmarks we tested the AMD Phenom 9950 using both the stock settings and our overclocked settings. Unlike the other benchmarks the results were identical, both rendered the 2148 frames in 35.8 seconds resulting in 60.0 fps, although this is because Doom 3 maxes out at 60 fps and cannot be played any higher.
 |
 |
|
AMD Phenom 9950 @ 2.6GHz
|
AMD Phenom 9950 @ 3.0GHz
|

Half Life 2 Episode 2

About Half Life 2 Episode Two:
Half Life 2 Episode 2 is the sequel to valves original Half Life 2. With the ending of episode one of Gordon Freedman leaving City 17, we find the ourselves in the country side with a vast surrounding environment. Once escaped from City 17, Gordon finds himself carrying important information that contains the location of the combine home world and information on how to stop the combine from opening the super portal and receiving a greater combine invasion.
Playing in such a lush environment we find the need for a higher performing hardware.
Benchmarking Half Life 2 Episode Two:
For benchmarking Half Life 2 Episode Two we will be using a combination of FRAPS and the built in timedemo. Similar to Doom 3, to run the timedemo you must first open the console and tell the game to run the time demo. Unfortunately Half Life 2 Episode Two doesn’t include a built in timedemo as Doom 3 did, so we decided make a recording where we felt the game stressed the components the most. To open the console you simply press “~” and type “timedemo <Demo_Name>” to run the timedemo.
Benchmark Results:
Similar to Doom 3, we maxed out the settings on Half Life 2. For a detailed list of which settings were chosen you may look at the pictures below.

Shown below are the results of running the game on max settings. For running the AMD Phenom 9950 at stock speeds (2.6GHz) we were able to receive 51.95 frames per second. But when we overclocked the processor to 3.0GHz we achieved 53.39 frames per second. Overall both results are remarkable and extremely playable, although we were expecting to see more of an increase running on the overclocked settings.
 |
|
AMD Phenom 9950 @ 2.6GHz
|
 |
|
AMD Phenom 9950 @ 3.0 GHz
|

Conclusion
The AMD Phenom X4 9950 Quad Core Processor looks as if it is an excellent choice for gamers and computer enthusiasts. It is currently the quickest of the AMD Phenom line and is priced very competitively with the equivalent Intel processor. Performing neck and neck with the Intel Q6600 (2.4GHz), the AMD Phenom 9950 (2.6GHz) becomes a formidable rival. Overall we have seen that the AMD Phenom 9950 can easily be overclocked to 3.0GHz and with more tweaking it can get much higher. Overall I feel as if the new Phenom 9950 is a good processor with a reasonable price. With review such a nice product, we look forward to future releases by AMD.
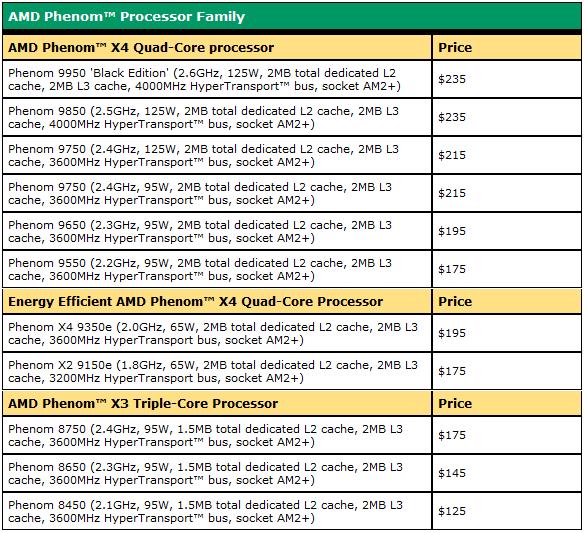
From the recent release of these new quad core processors, AMD has also lowered prices on the previously released processor. See the list of prices below (as of July 3rd, 2008).


Very good information! I am also having good success at 3.0 ghz so far. Thanks for the hard work on putting this together
I have been looking looking around for this kind of information. Will you post some more in future? I’ll be grateful if you will.
Great Blogging!!
Keep Your Good Work Going!!
is also preparing for a Monday launch of its new platform built around the new Phenom processors and the 700 series chipsets. While we are hearing nice things about the flagship 790FX chipset that will also be launched next week, the expectations are all about the processors, especially because it will give current AM2 socket motherboard owners the possibility of swapping and upgrading to the new generation of CPUs without having to change additional components.